
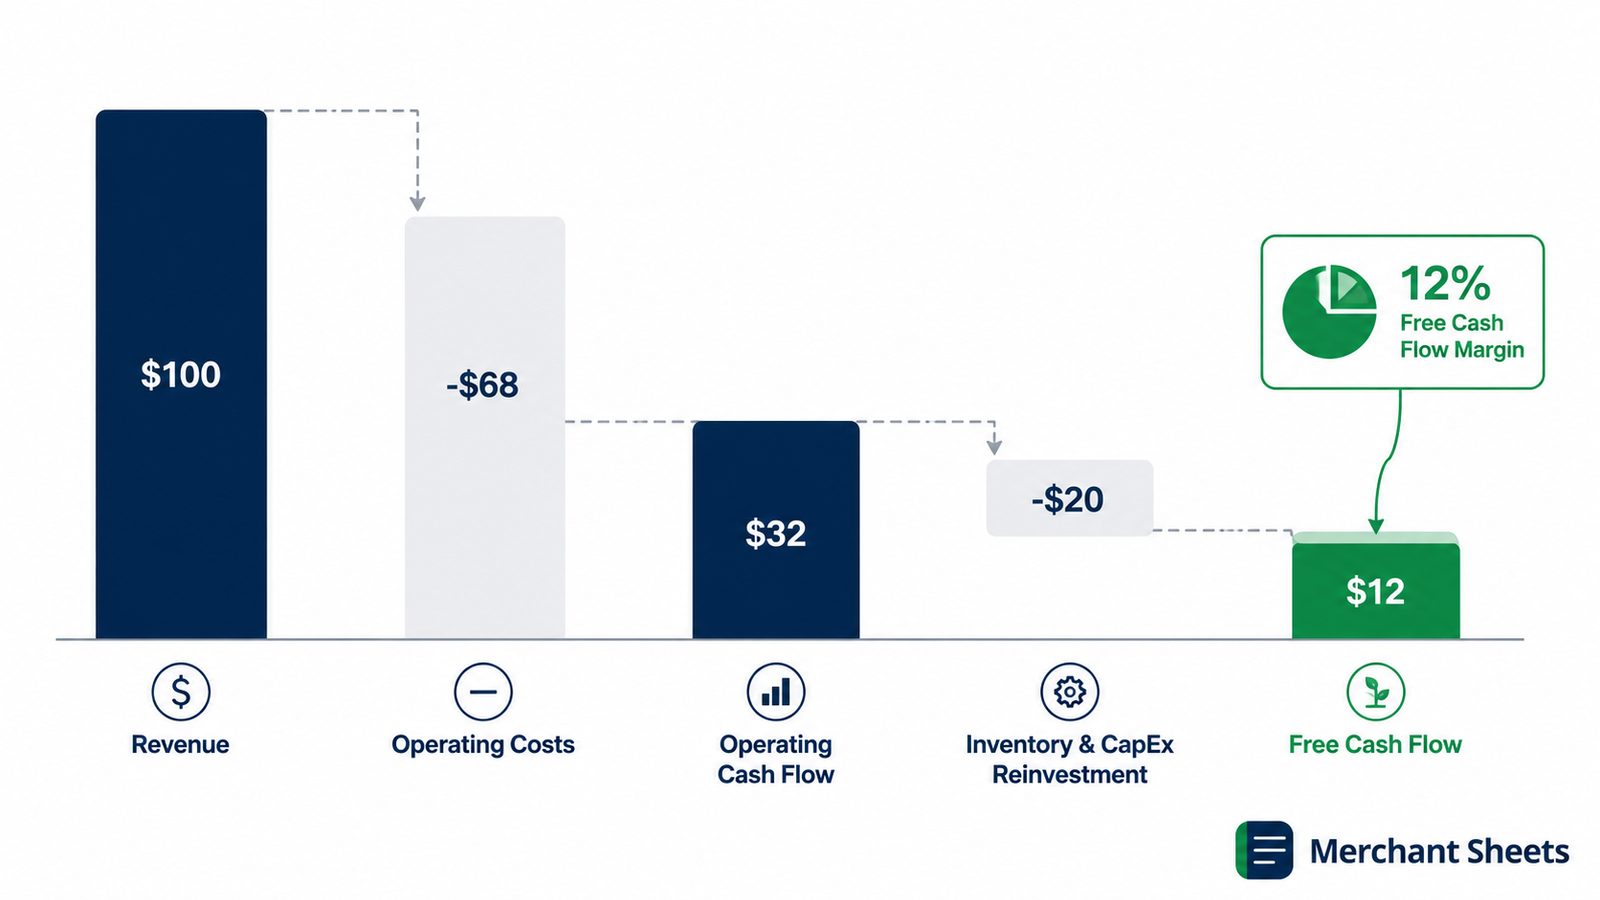
Free cash flow margin is the share of every revenue dollar your store keeps as cash after it covers operating costs and reinvestment. It’s where the P&L meets the bank account: a brand can look profitable on paper and still post a thin free cash flow margin because the cash is sitting in inventory.
Here’s the formula, what a good number looks like for an ecommerce store, and the levers that move it.
This guide covers what free cash flow margin is, how to calculate it, why inventory (not equipment) is what thins the number for most stores, the benchmark to measure yourself against, and how to improve it.
What is free cash flow margin?
Free cash flow margin is the percentage of revenue that survives as free cash flow after a business pays its operating costs and reinvests in the assets it needs. It answers one question: for every dollar of sales, how many cents end up as cash you can use — to pay down debt, build inventory, or take out of the business?
It’s a cash measure, so it can differ sharply from profit margin, which counts revenue and costs on an accrual basis regardless of when the money moves.
A store can earn a healthy profit and still convert little of it to cash in a given period. Free cash flow margin is the number that shows the difference.
The free cash flow margin formula
Free cash flow margin divides free cash flow by revenue. Free cash flow is operating cash flow minus capital expenditure, so the formula is:
Free cash flow margin = (operating cash flow − capital expenditure) ÷ revenue
Operating cash flow (OCF) is the cash your operations throw off — net income adjusted for non-cash items like depreciation and for the change in working capital, which is the cash tied up in inventory and receivables. Capital expenditure (CapEx) is cash spent on longer-lived assets: equipment, fixtures, warehouse buildout, software.
Subtract CapEx from OCF and you’ve got free cash flow, the cash left after keeping the business running and reinvested.
Take a store doing $2,000,000 in revenue. It earns $250,000 in net income, adds back $20,000 of depreciation, and puts $90,000 of new cash into inventory over the period.
That leaves operating cash flow of $180,000. After $20,000 of CapEx, free cash flow is $160,000 — an 8% free cash flow margin.
Table 1. Free cash flow margin worked from net income to FCF, $2M-revenue store.
| Line | Amount |
| Revenue | $2,000,000 |
| Net income | $250,000 |
| + Depreciation & amortization | $20,000 |
| − Increase in inventory (change in working capital) | ($90,000) |
| = Operating cash flow | $180,000 |
| − Capital expenditure | ($20,000) |
| = Free cash flow | $160,000 |
| Free cash flow margin | 8.0% |
The ecommerce twist: inventory is your real CapEx
The textbook formula subtracts capital expenditure, which points you at equipment and buildout. For most ecommerce stores, that line is small — you don’t buy factories. The cash that vanishes goes into inventory, and it doesn’t show up as CapEx at all. It sits inside operating cash flow as the change in working capital.
That’s why the $90,000 in the example above matters so much. When you buy more stock than you sell in a period — which is what growing stores do — that cash leaves the bank and lowers operating cash flow, dragging the free cash flow margin down with it.
The stock is still an asset on the balance sheet, so profit never flinches, but the cash is gone until those units sell.
So a growing, profitable brand can run a thin or even negative free cash flow margin while it pours cash into inventory ahead of demand. That isn’t automatically a problem — it’s the cost of growth.
The cash tied up in working capital is the same cash the cash conversion cycle measures in days. Free cash flow margin puts a percentage on how much of your revenue that reinvestment consumes.
What’s a good free cash flow margin?
A good free cash flow margin depends on your model and where you are in its life. As a general rule, businesses aim for 10–15%, and a margin under 5% is worth a second look unless you’re deliberately reinvesting for growth. Ecommerce runs lower, because working capital and fulfillment eat cash that a software business never spends.
Table 2. Free cash flow margin benchmarks, as of early 2026.
| Segment | Typical FCF margin | What it signals |
| General business, healthy | 10–15% | Efficient conversion of revenue into usable cash. |
| DTC ecommerce, top quartile | 12–18% | Strong for the model; lean working capital and tight ops. |
| DTC ecommerce, median | 4–8% | Normal, especially while inventory is growing. |
| Any business, below 5% | Under 5% | A flag — unless the cash is going into deliberate growth. |
Higher isn’t always better. A very high free cash flow margin can mean you’re under-investing — starving inventory or skipping the CapEx that keeps the store competitive — and borrowing cash flow today from growth you’ll miss tomorrow.
Read the number next to your growth rate, not on its own.
Free cash flow margin vs operating margin and net margin
Operating margin and net margin measure accrual profitability: revenue minus costs, before any cash timing. Free cash flow margin measures cash after reinvestment. The three answer different questions, and the gap between them is where working capital hides.
Go back to the $2M store. Its net income was $250,000, a 12.5% net margin. Its free cash flow was $160,000, an 8% free cash flow margin. Same store, same period — the 4.5-point gap is the $90,000 that went into inventory and the $20,000 of CapEx.
When you see a healthy profit margin sitting above a thin free cash flow margin, that gap is almost always cash locked in working capital.
How to improve your free cash flow margin
Every lever below lifts the cash side of the ratio — either by freeing cash trapped in the business or by growing revenue without a matching rise in cost. The biggest wins in ecommerce come from working capital, because that’s where the cash sits.
- Turn inventory faster: Every extra inventory turn pulls cash off the shelf and back into the bank, so less revenue gets consumed as working capital. It’s the single largest lever for most stores.
- Tighten the cash conversion cycle: Stretch supplier terms to hold cash longer, and speed up receivables and marketplace payouts to get cash sooner. Both shrink the gap that drains operating cash flow.
- Trim operating costs: Cut recurring software, renegotiate vendor contracts, and clear low-margin SKUs that soak up cash and warehouse space. Lower cash costs land straight in free cash flow.
- Time big buys to strong-cash weeks: Line up large inventory orders and any CapEx with the weeks your forecast shows the most cushion, so a single outflow doesn’t sink the period’s margin.
- Grow revenue efficiently: Raise prices or lift average order value where the market allows, so more revenue drops through without a proportional rise in cost. Efficient revenue widens the margin from the top.
Small moves compound. In the example store, cutting the inventory build from $90,000 to $40,000 by turning stock faster lifts operating cash flow to $230,000 and free cash flow to $210,000 — a 10.5% free cash flow margin, up from 8%, with no change in sales.
Watching those swings week by week in a cash flow forecast is how you catch them before they land.
See where your cash margin goes
Free cash flow margin tells you how much of your revenue turns into cash. It doesn’t tell you which week the cash gets tight, or which inventory buy thinned the margin.
The 13-Week Cash Flow Forecast lays out your weekly cash in and cash out, carries each week’s closing balance into the next, and shows the inventory bills and payout lags that pull the margin down — while there’s still time to act on them.
Fill in your receipts and payments, and read the margin before it lands.
Frequently asked questions
Can free cash flow margin be negative?
Yes, free cash flow margin goes negative whenever a business spends more cash than its operations bring in, which is common for a store investing hard in inventory or CapEx to grow. It’s a warning sign only if it’s unplanned or persists without the growth to justify it; a deliberate inventory build ahead of a strong season can turn it negative for a quarter without any cause for alarm.
What’s the difference between free cash flow margin and FCF conversion?
Free cash flow margin divides free cash flow by revenue, while FCF conversion divides free cash flow by a profit measure like EBITDA or net income. Margin tells you how much of each sales dollar becomes cash; conversion tells you how much of your profit becomes cash. They’re complementary — a thin margin with high conversion points to a low-profitability model, while a healthy margin with low conversion points to cash stuck in working capital.
Is a higher free cash flow margin always better?
No — an unusually high free cash flow margin can mean a business is under-investing in inventory, equipment, or growth, borrowing from future revenue to flatter today’s cash. A strong margin is good when it comes from efficient operations, and a warning when it comes from starving the things that keep the store growing. Read it against the growth rate.
How is free cash flow margin different from operating cash flow margin?
Operating cash flow margin stops at operating cash flow divided by revenue, while free cash flow margin also subtracts capital expenditure. In the example store, operating cash flow margin is 9% ($180,000 ÷ $2,000,000) and free cash flow margin is 8% after the $20,000 of CapEx. The gap between them is how much of your cash goes into long-lived assets.
