
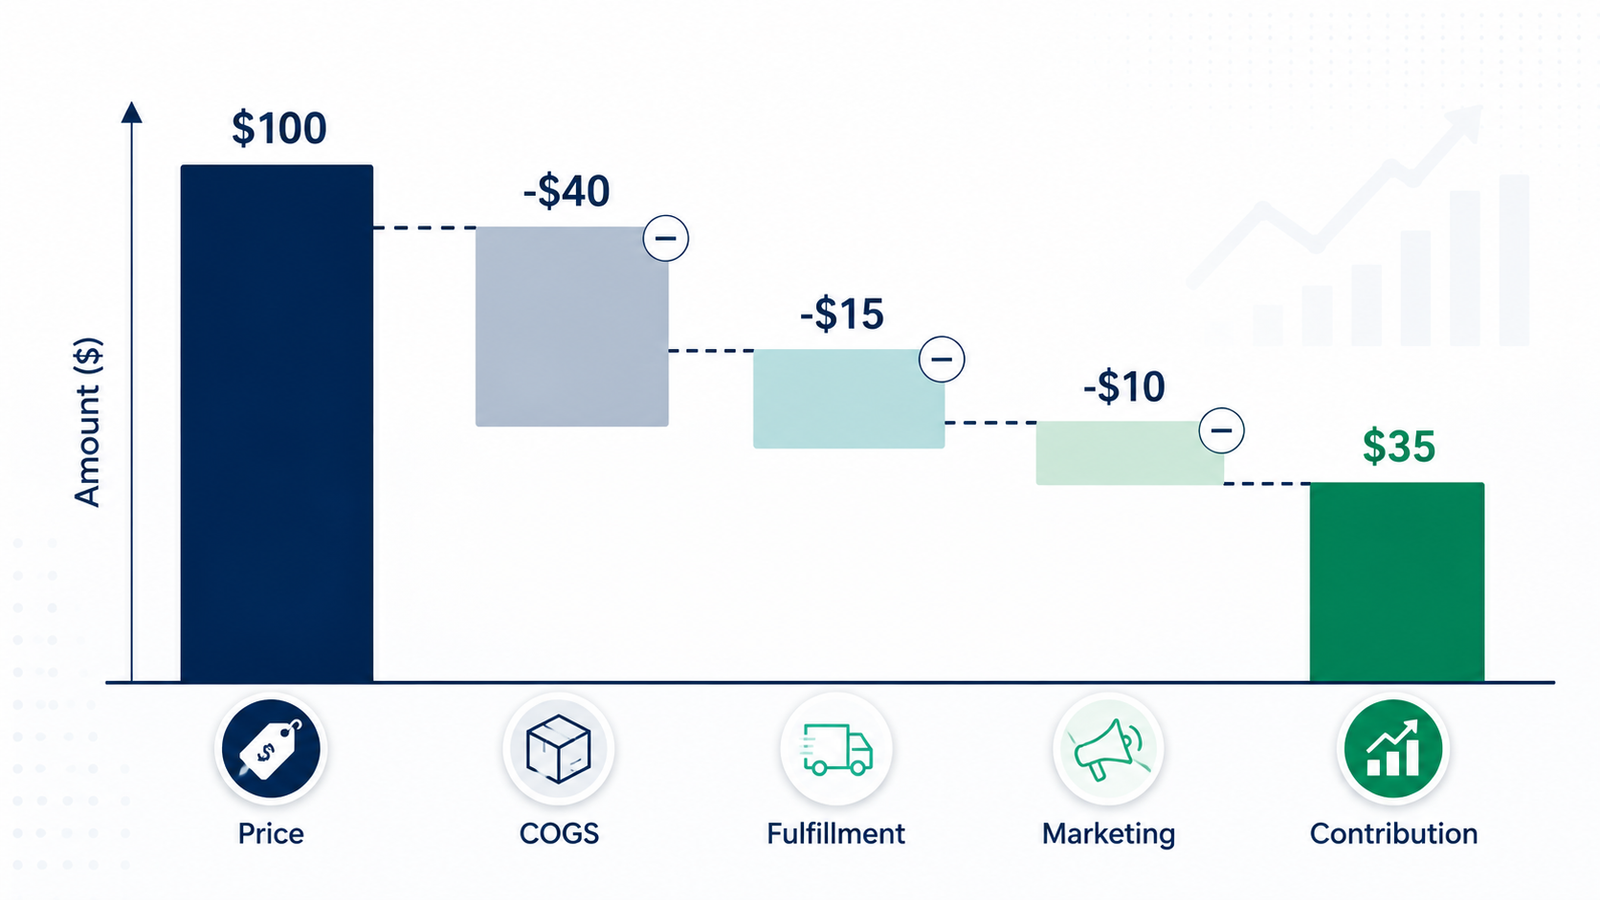
Contribution margin is what one sale leaves behind after its variable costs. It’s the money left to cover your fixed costs — rent, salaries, software — and, once those are paid, profit. Read it well and you’ll know how much you can spend to acquire a customer and which products carry the business.
This guide covers the formula, the CM ladder that direct-to-consumer (DTC) operators use to pressure-test each order, and how to read contribution margin by channel — so a healthy blended number doesn’t hide a channel that loses money on every sale.
What is contribution margin?
Contribution margin is a product’s price minus its variable costs — the costs that rise and fall with each unit you sell. It shows how much each sale contributes toward fixed costs and profit. You can measure it per unit or across all sales, as a dollar figure or as a percentage.
Variable costs move with volume: the product itself, payment fees, packing, shipping. Fixed costs stay flat whether you sell ten units or ten thousand — your lease, your core team, your accounting software. Contribution margin sits between the two and answers a plain question: after the cost of making and delivering this sale, how much is left to run the company?
The contribution margin formula
The formula is short. For a single unit, contribution margin equals price minus variable cost per unit. For the whole business, it’s revenue minus total variable costs. Same idea, different scale.
Say you sell a $40 candle. Here’s where the money goes on one order:
| Line item | Amount |
| Selling price | $40.00 |
| Product cost, or cost of goods sold (COGS) | −$12.00 |
| Payment processing | −$1.20 |
| Pick, pack & ship | −$2.80 |
| Contribution margin | $24.00 |
That $24 is what one candle contributes toward covering your fixed costs. Sell enough candles and those contributions cover the rent; every sale after that turns into profit.
What’s the contribution margin ratio?
The contribution margin ratio is contribution margin divided by revenue, shown as a percentage. For the candle, that’s $24 ÷ $40, or 60%. The ratio earns its keep when you compare products at different price points — a $40 candle and a $120 diffuser measured on the same yardstick. A higher contribution margin ratio means more of every dollar is left to cover fixed costs.
CM1, CM2, CM3: the contribution margin ladder
Most operators don’t stop at one contribution number. They read a ladder — CM1, CM2, CM3 — that peels back one layer of cost at a time. Each rung answers a sharper question about the same order.
| Rung | What you subtract | Question it answers |
| CM1 | Revenue − COGS (product + inbound freight) | Is the product itself profitable? |
| CM2 | CM1 − fulfillment, shipping, payment fees, returns | Is the order profitable to fulfill? |
| CM3 | CM2 − the variable ad cost to win the sale | Is the order profitable after acquisition? |
CM3 is the rung that keeps founders honest. A product can look healthy at CM1 and still lose money once you add the ad spend it took to sell it.
Contribution margin vs gross margin
Gross margin and contribution margin both start with revenue, which is why they get mixed up. Gross margin subtracts only cost of goods sold and shows the result as a percentage. Contribution margin keeps going, subtracting every variable cost — fulfillment, payment fees, per-order ad spend. Gross margin lines up with CM1; contribution margin usually means CM2 or CM3.
The practical difference: gross margin tells you whether the product is priced above its cost, while contribution margin tells you whether the whole transaction pays for itself. That gap is why a reassuring gross margin can sit on top of an order that still bleeds cash.
What counts as a variable cost?
Getting contribution margin right comes down to sorting costs into variable and fixed. A cost is variable if it grows with each additional order. A few sit in a gray area — warehouse software is fixed, but the pick-and-pack labor it schedules is variable — so judge each cost by whether it moves with volume. The usual variable costs on an ecommerce order:
- Product cost (COGS): What you pay your supplier per unit, plus inbound freight and any duty.
- Payment processing: The percentage a processor takes on each transaction.
- Pick, pack, and ship: The labor and materials to get one order out the door.
- Shipping: The carrier cost to deliver, net of what the customer pays at checkout.
- Per-order ad spend: The variable marketing tied to winning that specific sale.
- Returns and refunds: The reverse-logistics and restocking cost on the share of orders that come back.
How to read contribution margin across channels
A single, blended contribution margin can flatter you. The same product sells on your own site, on Amazon, and through wholesale, and each channel carries different variable costs — marketplace fees, a wholesale discount, its own shipping profile. Blend them together and a strong channel can mask one that loses money on every order.
A blended contribution margin hides your losing channels. Split it by channel and SKU before you trust it.
To calculate contribution margin for one of your own products, work one channel at a time:
- Start with the selling price for a single unit on one channel.
- Subtract the product cost, including inbound freight and duty.
- Subtract that channel’s variable selling costs — payment or marketplace fees, fulfillment, shipping, and per-order ad spend.
- Divide what’s left by the price to get the ratio, then repeat for each channel.
Frequently asked questions
Is contribution margin the same as profit?
No. Profit is what’s left after both variable and fixed costs, while contribution margin stops before fixed costs and shows the money available to cover them. Once your total contribution clears your fixed costs, the business turns a profit.
Does contribution margin include ad spend?
It depends on the rung. CM1 and CM2 leave ad spend out; CM3 subtracts the variable, per-order ad cost it took to win the sale, which is why CM3 is the truest read on a single order.
What’s a good contribution margin for ecommerce?
It varies by model and category, but many healthy DTC brands run a CM2 between 30% and 50% of revenue. As of early 2026 that’s a common working band — benchmark against your own history and category rather than a universal target.
Where to go next
Once you can read contribution margin by channel, the next question follows on its own: how much can you afford to spend to win a customer? That’s where the contribution margin ratio and your break-even ad math take over.
