
Safety stock is the buffer inventory you hold to keep selling when demand runs hot or a shipment shows up late. Size it well and a supplier delay or a viral week costs you nothing. Size it too low and you stock out; too high and cash sits frozen on the shelf. The safety stock formula is how you find the level that fits your own demand and lead time.
This guide walks through two ways to calculate safety stock — a quick method built on your best and worst cases, and a statistical method tied to a service level you choose — then shows how safety stock sets the reorder point that tells you when to buy. Each formula comes with a worked example on the same product, so you can see how the numbers move.
What is safety stock?
Safety stock is extra inventory held as a buffer against uncertainty in demand and supply. It sits beneath the stock you expect to sell during a normal reorder cycle and absorbs the swings a forecast can’t predict — a demand spike, a slow shipment — so you keep filling orders while you wait for the next delivery.
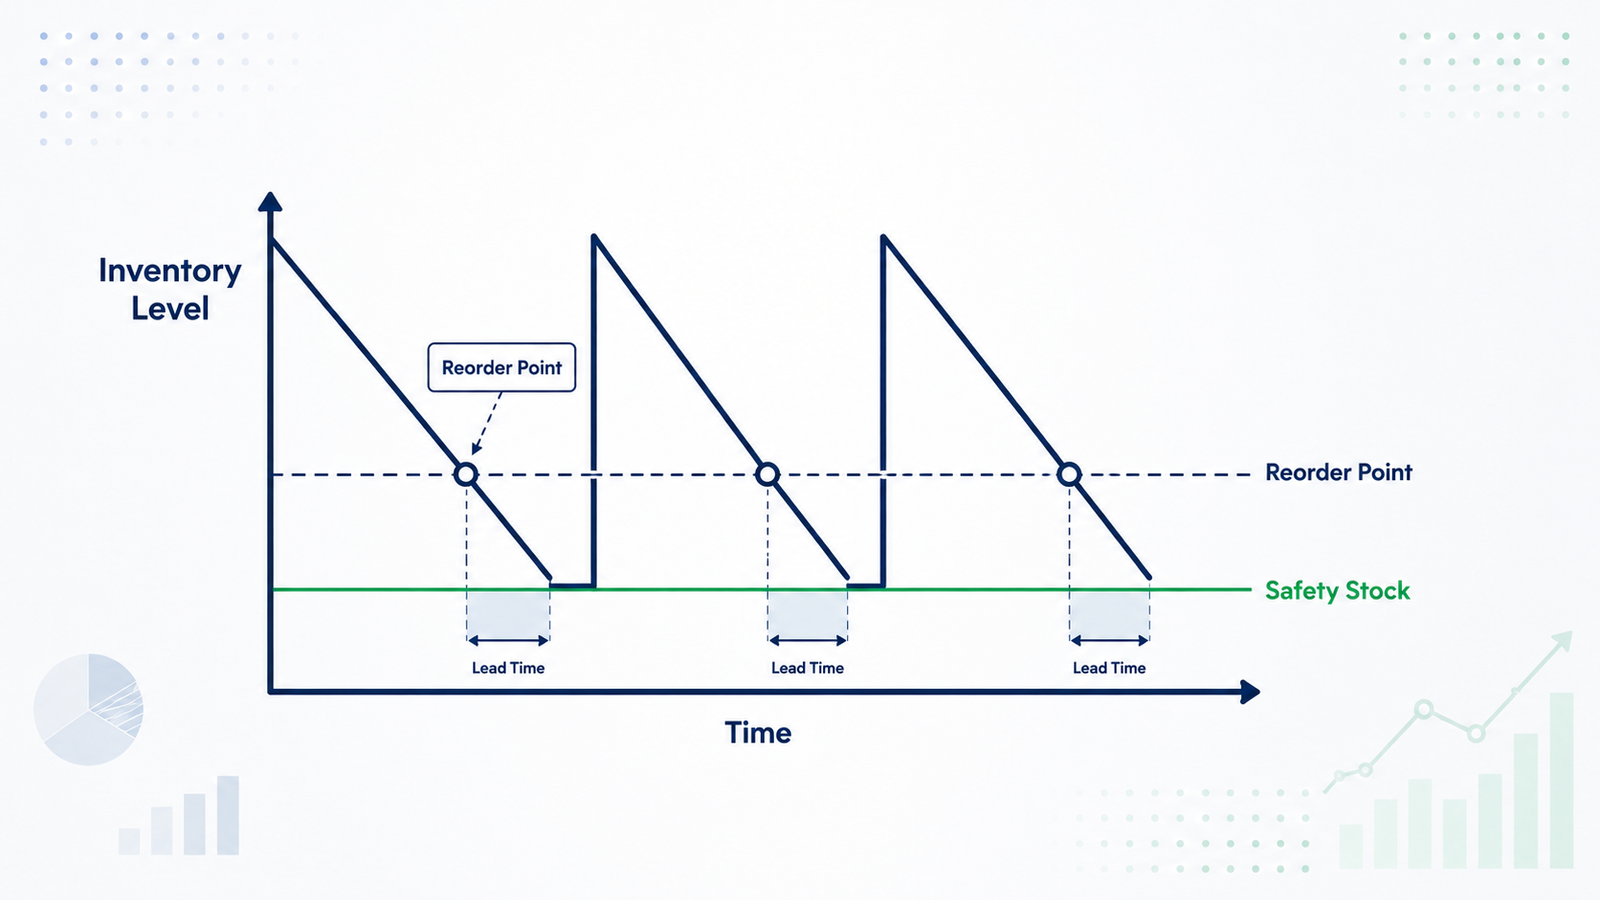
Think of your inventory as drawing down in a saw-tooth: it falls as you sell, then jumps back up when a purchase order lands. Safety stock is the floor that saw-tooth is meant to bounce off, rather than crash through. In a calm week you never touch it. In a bad one, it’s what stands between a late delivery and a sold-out listing. The whole job of the formulas below is to set that floor at a level you can defend on cost.
Why you need safety stock
Two kinds of variability make a buffer necessary. Demand variability is the day-to-day swing in how much you sell — a promo, a season, a mention that moves units faster than your average. Lead-time variability is the swing in how long replenishment takes — a factory backlog, a customs hold, a missed sailing. Either one can empty a shelf that looked fine on the spreadsheet.
Safety stock is the answer to a real cost. A stockout loses the sale, and often the customer, plus any expedite fees you eat to recover. Carrying a buffer has its own price, though: it’s cash tied up in inventory, along with storage and the risk the goods go stale before they sell. Safety stock is where you set the dial between those two costs on purpose, instead of discovering it the hard way when an order lands late.
A forecast on its own won’t save you here. Even a good forecast is an average, and averages come in high half the time and low the other half. Safety stock covers the half where real demand lands above your forecast, or your supplier lands behind schedule — the times a single expected number was always going to miss.
Safety stock is a buffer against variability. When demand is drifting up or down week after week, that’s a forecast to fix at the source — buffer stock only masks the miss and ties up cash doing it.
The safety stock formula (basic method)
The simplest way to size safety stock uses your best and worst cases. You compare a worst-case sales run against an average one, over the longest time a delivery might take:
Safety stock = (maximum daily usage × maximum lead time) − (average daily usage × average lead time)
Say a SKU sells 20 units a day on average, and a purchase order usually lands in 10 days. On its busiest days it moves 30 units, and a slow shipment has taken as long as 14 days. Plug those in:
| Input | Value |
| Average daily usage | 20 units |
| Average lead time | 10 days |
| Maximum daily usage | 30 units |
| Maximum lead time | 14 days |
Safety stock = (30 × 14) − (20 × 10) = 420 − 200 = 220 units. That 220-unit buffer covers the gap between a normal cycle and a worst-case one.
This method earns its place when you only have high and low ranges rather than a full sales history. It runs conservative, because it stacks your busiest demand on top of your slowest delivery and assumes both hit at once. That pairing is rare, so the basic method tends to hold more buffer than you strictly need. Treat its output as a starting ceiling to trim from once you have enough sales history to measure your variability directly — which is what the next method does.
The safety stock formula with service levels
The more precise method ties safety stock to a service level — the share of the time you want to meet demand from stock. A 95% service level means you plan to fill demand 95% of the time and accept a stockout in the remaining 5%. Aiming higher costs more buffer, so you set the service level deliberately, as a business decision that can differ by product.
With a service level chosen, the statistical formula is:
Safety stock = Z × σ × √(lead time)
Z is the service-level factor — a multiplier tied to the service level you picked. σ (sigma) is the standard deviation of daily demand, a measure of how much your daily sales bounce around the average. Lead time is in days. The square root reflects that risk grows with the length of the wait, but slower than one-for-one, so doubling the lead time raises the buffer by about 40%, not 100%.
The Z factor comes from a standard table. The common service levels:
| Service level | Z factor |
| 90% | 1.28 |
| 95% | 1.65 |
| 98% | 2.05 |
| 99% | 2.33 |
Take the same SKU. Its daily demand varies with a standard deviation of 5 units, the lead time is 10 days, and you’re targeting a 95% service level, so Z is 1.65. Safety stock = 1.65 × 5 × √10 = 1.65 × 5 × 3.16 ≈ 26 units.
That’s a long way from the 220 units the basic method gave. Both are defensible; they answer different questions. The basic method asks what covers the worst demand and the worst delivery landing together. The service-level method asks what covers normal variation to a 95% confidence — a leaner, more realistic target when you have the sales history to measure σ.
| Method | Safety stock | Reorder point |
| Basic (max − average) | 220 units | 420 units |
| Service-level, 95% (Z × σ × √LT) | 26 units | 226 units |
This version assumes your lead time is fairly steady and most of the risk lives in demand. When the lead time itself swings hard — a supplier that lands anywhere from 8 to 20 days — that variation deserves its own place in the math. A fuller version of the formula adds the standard deviation of lead time alongside the standard deviation of demand, so an unreliable supplier raises the buffer even when your sales are smooth.
For most SKUs the demand-only formula is close enough to start; reach for the extended version when a supplier’s timing is the thing keeping you up at night.
Choosing a service level
The service level is the lever you pull in practice, and it moves safety stock through the Z factor. Push the service level up and the buffer grows, with diminishing returns — each step buys less added protection than the one before. Here’s the same SKU across four service levels:
| Service level | Z factor | Safety stock | Reorder point |
| 90% | 1.28 | 20 units | 220 units |
| 95% | 1.65 | 26 units | 226 units |
| 98% | 2.05 | 32 units | 232 units |
| 99% | 2.33 | 37 units | 237 units |
Moving from 95% to 99% adds only 11 units of buffer, yet every one of those units carries holding cost and can’t be spent elsewhere. The extra stock buys a smaller and smaller cut of stockout risk the higher you climb, which is why chasing 100% is a trap — the last sliver of risk costs the most to cover and never fully disappears.
So pick the service level by the SKU. A high-margin product, a hero item customers won’t wait for, or one with a long and shaky lead time earns a 98% or 99% target. A low-margin, easily reordered commodity can sit at 90% and free up the cash. The point is to choose per SKU rather than run one blanket number across the catalog, and to revisit the choice as a product’s demand settles or its supplier gets more reliable.
Safety stock and the reorder point
Safety stock tells you how big a buffer to hold. The reorder point (ROP) tells you when to place the order, and it’s built on the same numbers:
Reorder point = (average daily usage × average lead time) + safety stock
For the SKU at a 95% service level, that’s (20 × 10) + 26 = 226 units. When on-hand inventory drops to 226, you place the purchase order. The 200 units you expect to sell during the 10-day wait draw the stock down, while the 26-unit buffer covers any surprise before the delivery lands. Safety stock is the cushion; the reorder point is the trigger that puts it to use.
The two are always calculated together, and the reorder point is worth its own walkthrough once you’ve sized the buffer behind it.
How to calculate safety stock for your SKUs
To run this on your own catalog, work one SKU at a time:
- Pull the demand history: Get daily or weekly sales for the SKU and calculate the average and the standard deviation of daily demand.
- Measure the lead time: Use the average days from purchase order to received stock, and note how much it varies — a number worth measuring rather than guessing.
- Pick a service level: Set it by the SKU’s margin, how replaceable it is, and how shaky its lead time is, then read the Z factor from the table.
- Run the formula: Multiply Z × σ × √(lead time) for safety stock, then add average usage × average lead time to get the reorder point.
Getting the lead time right
Lead time does a lot of work in both formulas, so it pays to base it on real receiving data rather than a supplier’s promise. Measuring your supplier lead time accurately is a task on its own, and it’s the input that most often throws these numbers off. Once you have clean demand and lead-time figures, the Reorder Point / Safety Stock template runs the safety stock formula for every SKU so you don’t rebuild the math by hand each cycle.
Frequently asked questions
What's a good safety stock level?
A good safety stock level is the smallest buffer that holds your target service level for that SKU, which depends on how much its demand and lead time vary rather than a flat number of days or units. A steady seller with a reliable supplier needs little; a spiky product on a long, unpredictable lead time needs much more to hit the same service level. Size it per SKU and revisit it as those patterns change.
Can safety stock be too high?
Yes, safety stock that never gets touched is cash and shelf space locked against a risk that isn’t showing up, and it can mask a slow-moving or over-forecast SKU. If a buffer sits untouched cycle after cycle, the demand or lead-time variability you sized it for has probably eased, and the level is due for a trim. Reviewing buffers is as important as setting them.
Does safety stock change with the season?
Yes, safety stock should rise heading into a peak and ease afterward, because both average demand and its variability climb during a busy stretch. Recalculate the buffer using demand data from a comparable period rather than a flat annual average, so the service level holds when volume is highest and you’re not carrying peak-season stock through a quiet quarter.
What's the difference between safety stock and the reorder point?
Safety stock is the buffer quantity, while the reorder point is the on-hand level that triggers a new order. The reorder point includes safety stock plus the stock you expect to sell during the lead time, so safety stock is one component of the reorder point rather than a separate rule.
Size every buffer without redoing the math
Running these formulas by hand is fine for one SKU. Across a full catalog, with lead times and demand shifting each season, it becomes a spreadsheet job. The Reorder Point & Safety Stock template takes your demand and lead-time inputs, calculates safety stock and the reorder point for every SKU at the service level you set, and flags what’s due to reorder. Set the buffer once and let the sheet keep it current.
