
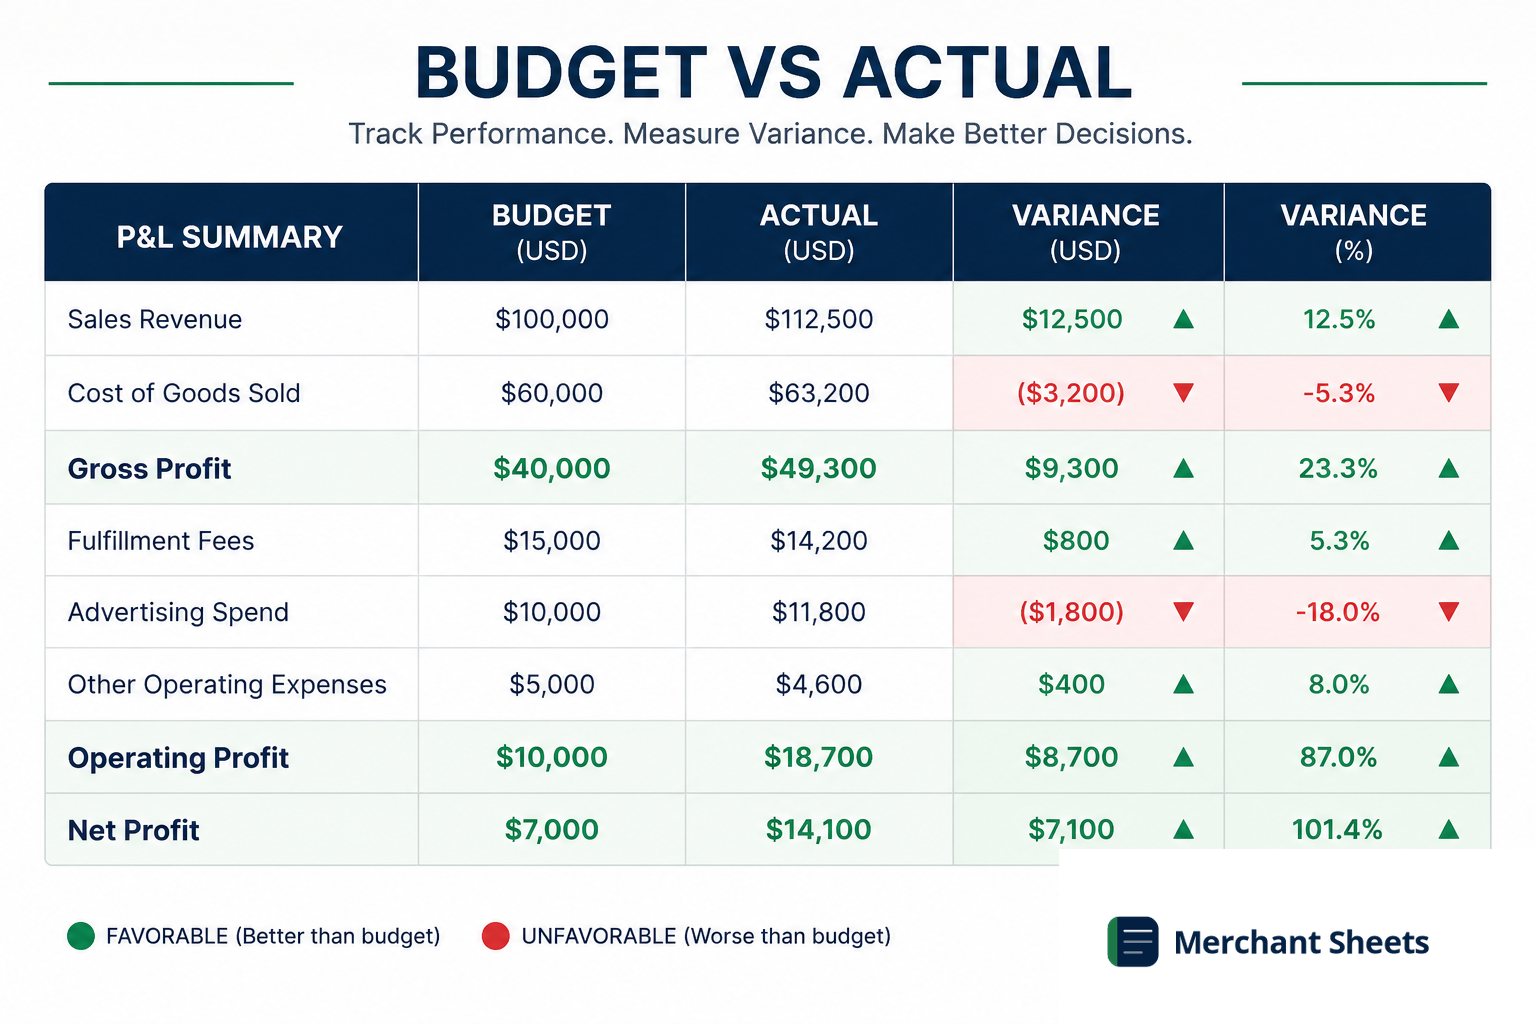
Budget vs actual puts what you planned next to what happened, line by line, so you can see where the month went off script. The gaps between the two columns — the variances — are where the lesson lives. A revenue miss, an overspend on ads, a supplier bill that came in light: the report surfaces each one while there’s still time to act on it.
This guide covers the variance formula, the favorable-versus-unfavorable rule that trips most people up, a worked example on a monthly P&L, and how to build the whole report in Excel.
What is budget vs actual?
Budget vs actual is a report that compares your budgeted figures to your actual results for the same period, line by line, and measures the gap on each. That gap is the variance, and reading the variances — variance analysis — is how you turn a pile of numbers into a short list of things that went differently than planned.
It’s the backbone of a monthly close. You set a budget at the start of the year or quarter, usually pulled straight from your financial model, the month happens, and the report lines up the two so nothing hides. Revenue, cost of goods, each expense line, and profit all get the same treatment: planned, actual, and the difference between them. The value is in the discipline — it forces you to look at every line, including the ones you’d rather not.
The variance formula
A variance is the difference between actual and budget, and you read it two ways — in dollars and as a percentage:
Variance ($) = actual − budget Variance (%) = variance ÷ budget
The dollar variance tells you how big the miss is; the percentage tells you how big it is relative to the line. A $2,000 variance is a rounding error on a $200,000 revenue line and a crisis on a $4,000 one, so you want both numbers side by side. On their own, either can mislead — a huge percentage on a tiny line, or a small percentage hiding a large dollar figure.
The part that trips people up is the sign. A variance above budget isn’t automatically good; it depends on the line. For revenue and profit, coming in above plan is favorable; for costs, coming in below plan is favorable. The report marks each line favorable (F) or unfavorable (U) on that logic, so you read the health of a line rather than the raw direction of the number.
Favorable means better than plan: revenue and profit above budget, or costs below it. Unfavorable is the reverse. Judge each line by whether the gap helps or hurts profit rather than by its sign.
How to build a budget vs actual in Excel
The report is five columns next to your line items: budget, actual, dollar variance, percent variance, and a favorable/unfavorable flag. Here’s the layout on a single month’s P&L:
| Line item | Budget | Actual | Var $ | Var % | F/U |
| Revenue | $100,000 | $92,000 | −$8,000 | −8% | U |
| COGS | $40,000 | $38,000 | −$2,000 | −5% | F |
| Gross profit | $60,000 | $54,000 | −$6,000 | −10% | U |
| Marketing | $20,000 | $24,000 | +$4,000 | +20% | U |
| Other opex | $25,000 | $24,000 | −$1,000 | −4% | F |
| Net profit | $15,000 | $6,000 | −$9,000 | −60% | U |
The formulas behind it are short. The dollar variance is a subtraction, the percent variance divides that by the budget, and the flag is a quick logic test that knows whether the line is revenue or cost. To build it:
- Lay out the columns: Put line item, budget, actual, variance $, variance %, and F/U across the top, with your P&L lines down the side.
- Enter the variance formulas: Set variance $ to =Actual − Budget and variance % to =Variance ÷ Budget, then copy them down every line.
- Flag favorable and unfavorable: Use an IF test that treats a positive variance as favorable on revenue and profit lines and unfavorable on cost lines.
- Add conditional formatting: Color favorable variances green and unfavorable red so the month’s story reads at a glance.
- Roll it up: Subtotal to gross profit and net profit so you see whether the small variances net out or compound.
Reading this month
The example tells a clear story. Revenue came in 8% light, and marketing ran 20% over budget on top of it, so even though COGS and other opex landed favorable, net profit fell to $6,000 against a $15,000 plan — a 60% miss.
The two red lines caused it, and the Budget vs Actual Variance Tracker builds this whole view from your budget and actuals, so you spend the month acting on the variances instead of assembling them.
How to read the variances
A finished report can show a variance on every line, and most of them don’t matter. Variance analysis is deciding which ones do and chasing those to a cause, so the report answers one question each month: what changed, and is it a blip or a trend? A few habits keep it useful:
- Set a materiality threshold: Ignore anything under a dollar or percent floor — say $1,000 or 5% — so you spend your time on the lines that move the number.
- Split price from volume: A revenue miss can come from selling fewer units or from selling them cheaper, and the fix for each is different.
- Tell timing from permanent: A bill that landed a month early is a timing variance that reverses next month; a supplier price increase is permanent and belongs in the forecast.
- Start with the biggest movers: Explain the two or three lines that drove most of the profit gap before touching the small stuff.
From variance to action
Each explained variance points somewhere. A volume miss sends you to demand and conversion; a cost overrun sends you to the vendor or the brief that authorized it; a favorable line worth repeating sends you to whatever you did right.
The report earns its place only when it ends in a decision, so close every month by naming the one or two things you’ll change because of what it showed.
How often to run it
Budget vs actual is a monthly ritual, run at close once the books are final, against both the budget and the prior month for context. It sits alongside the KPIs you track monthly as the other half of the reporting pack: the KPIs show how the business is performing, and the variance report shows how that performance compares to the plan.
A quick month-to-month read also catches a trend a budget comparison alone can miss, since the budget was set long ago and the recent past is fresher.
When the same line misses month after month, the problem isn’t the actuals — it’s the budget. At that point you stop re-explaining the variance and reforecast the rest of the year, so the plan you’re measuring against reflects what you now know. Persistent variances are a signal to update the number rather than keep apologizing for it.
Frequently asked questions
What's a favorable versus unfavorable variance?
A favorable variance is one that helps profit — revenue or profit above budget, or a cost below it — and an unfavorable variance is the reverse. The label depends on the line, so an actual above budget is favorable on revenue but unfavorable on an expense. Read each line by its effect on profit rather than by whether the number went up or down.
What counts as a material variance?
A material variance is one big enough to change a decision, which most teams define with a threshold like 5% of the line or a fixed dollar amount, whichever fits the business. The point is to filter: a 2% wobble on a stable line is noise, while a 20% swing or a five-figure gap earns an explanation. Set the bar once and apply it consistently.
Should you look at the month or year-to-date?
Look at both, because they answer different questions. The single month shows what happened that month and catches a fresh problem early; the year-to-date view smooths out timing noise and shows whether you’re on track against the annual plan. Most monthly packs put the month and the YTD side by side so a one-off doesn’t get read as a trend, or the reverse.
What's the difference between budget, forecast, and actual?
Budget is the plan you set at the start and hold fixed as a scorecard; forecast is your updated expectation as the year unfolds; and actual is what really happened. Budget vs actual measures performance against the original plan, while a reforecast resets expectations when the budget no longer reflects reality.
Run it in minutes, every month
Building the columns and the flag logic once is fine; rebuilding them every close is a tax on your month.
The Budget vs Actual Variance Tracker drops your budget and actuals side by side, calculates the dollar and percent variances, flags favorable and unfavorable lines, and rolls them up to gross and net profit. Fill in two columns and read the story.
