
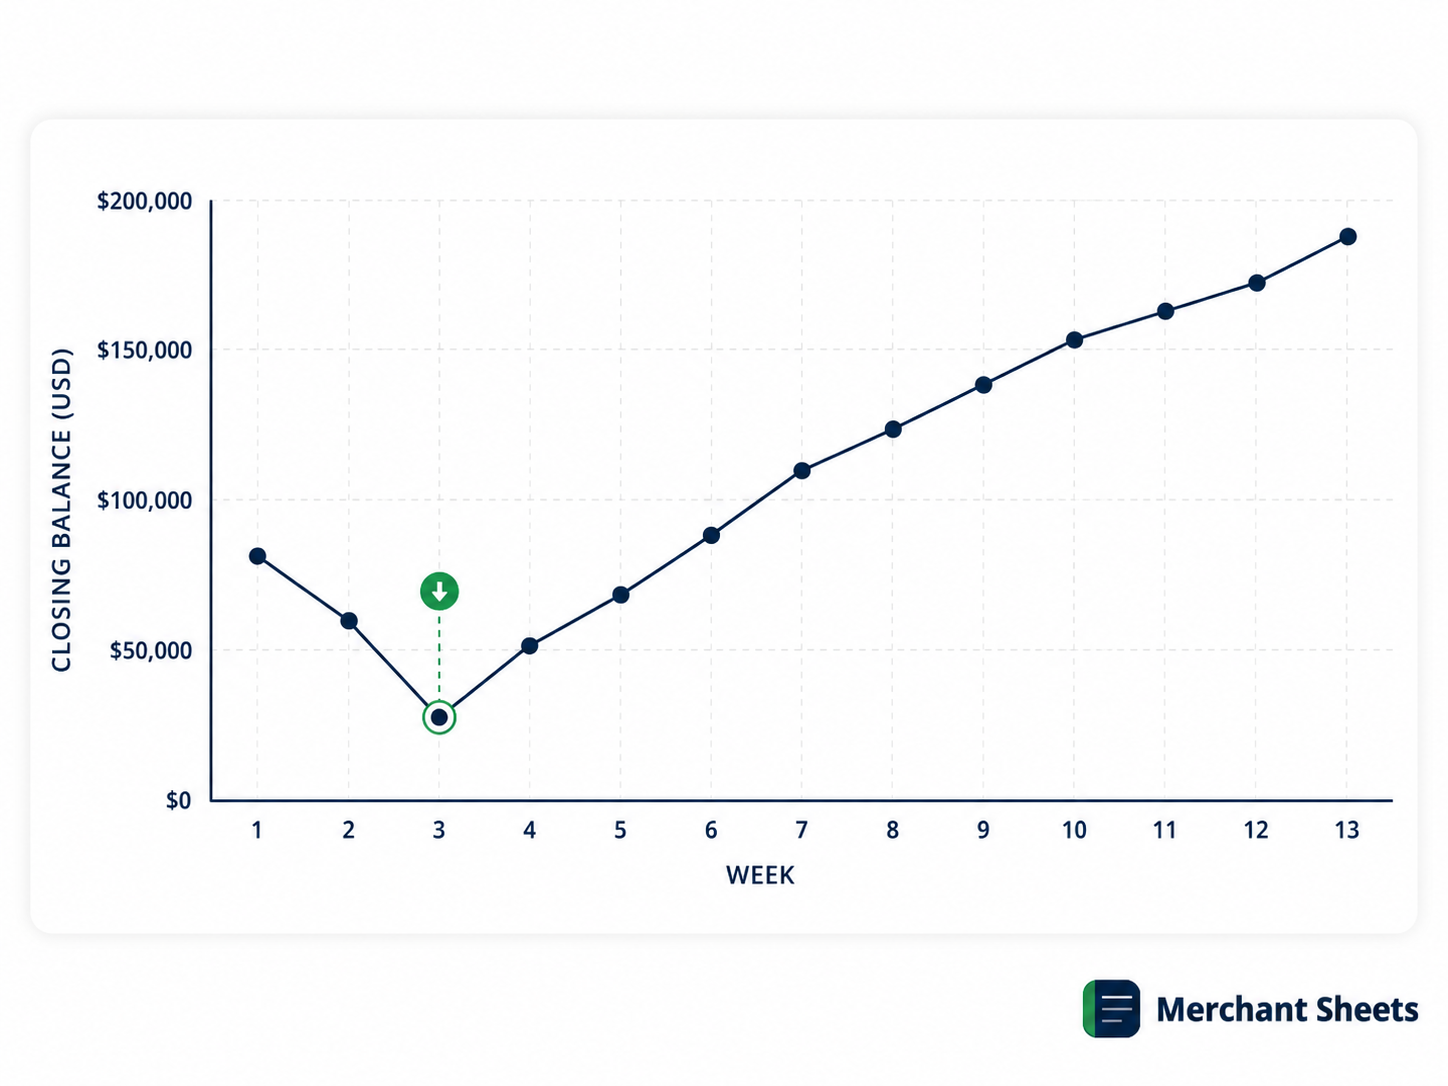
A 13-week cash flow forecast shows the cash moving in and out of your store, week by week, for the next quarter. It’s the report that tells you whether you can cover next month’s inventory order before you place it, and it’s separate from whether the business is profitable. Plenty of profitable stores have run out of cash because the money came in later than the bills went out.
This guide covers what a 13-week forecast is, why the timing of payouts and inventory bills makes ecommerce cash forecasting its own skill, a worked example, and how to build the model in Excel and keep it rolling.
What is a 13-week cash flow forecast?
A 13-week cash flow forecast is a rolling, week-by-week projection of the cash coming into and going out of your business over the next quarter. It tracks real money movement — payouts received, bills paid — rather than accrual revenue and expense, and it ends each week with a closing cash balance that carries into the next. The result is a clear line of sight to the lowest your bank account will get, and the week it happens.
It’s a direct forecast, built from expected receipts and disbursements. That’s what makes it usable week to week: you’re listing the cash you expect to land and the payments you expect to make, on the weeks they’ll happen, and letting the balance roll forward.
Profit doesn’t enter into it — a month can look strong on the P&L and still leave you short if the cash arrives on the wrong side of a big payment. The forecast’s whole job is to keep that from catching you out.
Why 13 weeks
Thirteen weeks is one quarter, and it’s the sweet spot for short-term cash. It’s near enough that you can forecast receipts and payments with real accuracy, and far enough that a cash squeeze shows up with weeks to spare rather than the morning a payment bounces. Shorter than that and you’re flying blind into the next big inventory bill; much longer and the weekly numbers turn into guesses you can’t act on.
The forecast is rolling. Each week you drop the week that closed, add a fresh week 13 at the far end, and update the near weeks with what you now know. Done that way it always shows a full quarter ahead, and your burn rate and runway fall straight out of it: burn is how fast the balance drops, and runway is how many weeks the cash lasts at that pace.
If the closing balance trends toward zero in week 9, that’s your runway, visible today rather than in hindsight. Watching it weekly, instead of checking the bank balance and hoping, is the difference between managing cash and reacting to it.
What goes into it
Every week in the forecast has the same shape: you start with the cash you have, add what comes in, subtract what goes out, and end with a closing balance that becomes next week’s opening. The lines that fill it:
| Section | What it holds |
| Opening cash | The bank balance at the start of the week |
| Cash in | Shopify and Stripe payouts, Amazon disbursements, wholesale receipts, refunds, loans drawn |
| Cash out | Inventory deposits and balances, ad spend, payroll, rent and software, loan payments, taxes, owner draws |
| Net cash flow | Cash in minus cash out for the week |
| Closing cash | Opening plus net — and next week’s opening |
The two summary lines are what you watch. Net cash flow tells you whether the week added to the pile or drew it down; closing cash tells you how much cushion is left going into the next one. String thirteen of these together and the closing-cash line is the story of your quarter.
Two of these lines are really working-capital timing in disguise. The gap between paying for inventory and collecting the cash those units eventually generate is net working capital, and it’s the single biggest reason a growing store’s cash and its profit drift apart — every dollar of growth pulls more cash into stock before it comes back out as sales.
The faster you grow, the more the forecast has to work to keep that gap from swallowing the cash you’re earning.
Timing is everything
Here’s what separates an ecommerce cash forecast from a generic one: the cash rarely moves when the sale does. You sell today, but the money lands on its own schedule, and your biggest bills land on theirs. Getting the weeks right is the whole game, and it’s where most first forecasts go wrong.
On the way in, every channel pays out on a lag. A Shopify or Stripe sale settles to your bank a couple of business days later; an Amazon disbursement arrives roughly every two weeks, well after the orders shipped; a wholesale invoice sits on net-30 or net-60 terms before it pays.
Put each receipt in the week it lands, rather than the week the order was placed, or the forecast will show cash you don’t yet have.
The usual payout timing, channel by channel:
| Channel | Typical payout timing |
| Shopify / Stripe | About 2 business days after the sale |
| Amazon | Disbursed roughly every 14 days |
| Wholesale (net terms) | 30 to 60 days after the invoice |
| Card reserves / holds | A slice held back, released later |
On the way out, inventory is the line that breaks a naive forecast. You rarely pay for a production run all at once — a deposit of perhaps 30% goes out when you place the order, and the 70% balance comes due when the goods ship, often weeks apart and weeks before those units sell.
Model the deposit and the balance as two separate outflows on their real weeks, and the scary week stops being a surprise.
The fix is a one-time job: map each channel’s payout schedule and each supplier’s payment terms once, and the weekly timing mostly takes care of itself. It matters most exactly when the stakes are highest — a Q4 inventory build, where you pay for stock weeks before the holiday sales that fund it land in the bank.
A cash forecast tracks when money moves — payout dates and bill due dates — even when the P&L looks fine. A profitable month can still run you dry if receipts land after the bills do.
A worked example
Take a store opening the quarter with $50,000 in the bank. The first weeks tick along, then a large inventory balance comes due in week 3:
| Week | Opening | Cash in | Cash out | Closing |
| Week 1 | $50,000 | $42,000 | $48,000 | $44,000 |
| Week 2 | $44,000 | $40,000 | $46,000 | $38,000 |
| Week 3 | $38,000 | $41,000 | $72,000 | $7,000 |
| Week 4 | $7,000 | $55,000 | $45,000 | $17,000 |
Week 3 is the one that matters. The $72,000 out — mostly the balance on a production order — drops closing cash to $7,000, a thin cushion for a store this size. Nothing here is a disaster: the business is still taking in $40,000-odd a week and recovers by week 4.
The point is that you can see week 3 coming from week 1, with two weeks to act — move the supplier balance a week later, pull an Amazon payout forward, or draw on a credit line — instead of discovering it the day the payment clears.
Read on a P&L, these same four weeks might look perfectly healthy — the inventory sitting in that $72,000 payment lands on the balance sheet as an asset rather than hitting the P&L as an expense, so profit never flinches while the bank account nearly empties.
How to build it in Excel
The model is a grid: line items down the side, thirteen weeks across the top, each week a column that resolves to a closing balance. To build it:
- Set up the weeks: Put your cash line items down column A and label thirteen week-ending dates across the top, starting from this week.
- Enter opening cash: Put your current bank balance in week 1’s opening row; every later week’s opening links to the prior week’s closing.
- List receipts by when they land: Enter each payout, disbursement, and wholesale payment in the week it hits the bank, rather than the week of the sale.
- List payments by when they clear: Enter ad spend, payroll, rent, loan payments, and inventory deposits and balances in the weeks they’re due.
- Total each week: Net cash flow is cash in minus cash out; closing cash is opening plus net, and it feeds the next week’s opening.
- Add a runway read: Highlight the lowest closing balance across the thirteen weeks so the tightest point is obvious at a glance.
Keeping it rolling
A cash forecast earns its keep only if it stays current. Once a week, at the same time you reconcile the bank, do three things: replace the week that closed with what really happened, update the near weeks with anything you’ve learned, and add a new week 13 at the far end so you’re always looking a full quarter out.
Comparing each week’s forecast to what landed is where the model gets sharper. When your payout timing or inventory estimates run consistently off, you adjust the assumptions and the next quarter’s forecast tightens up. Pair the forecast with the weekly cash KPIs so you’re watching both the projection and the handful of metrics behind it — a forecast you update weekly is worth far more than a perfect one built once and left to rot.
Frequently asked questions
What's the difference between the direct and indirect method?
The direct method forecasts cash straight from expected receipts and payments, which is what a 13-week model uses because it maps to the weeks money moves. The indirect method starts from net income and adjusts for non-cash items and working-capital changes, and it’s how the statement of cash flows is built for reporting. For weekly cash management, the direct method is the practical one.
How is a cash flow forecast different from a P&L?
A cash flow forecast tracks when money enters and leaves the bank, while a P&L measures profit on an accrual basis — revenue when it’s earned and costs when they’re incurred, regardless of timing. The two can tell very different stories in the same month: a profitable P&L can sit on top of a cash crunch when a big inventory payment lands before the sales it funds pay out.
How far out should I forecast?
Thirteen weeks is the standard horizon for operational cash, since a quarter is long enough to see inventory and seasonal swings coming and short enough to forecast with accuracy. Keep a rougher annual view for planning if you like, but manage the week-to-week cash on the 13-week model and roll it forward every week.
What should I do if the forecast shows a shortfall?
Act on the weeks you can still change, which is the reason to forecast a full quarter out. A shortfall in week 9 gives you two months to close the gap: pull receipts forward by tightening wholesale terms or offering an early-pay discount, push payments back by renegotiating a supplier balance date, trim or delay discretionary spend, or line up credit before you need it. The forecast’s value is that these options are open while the shortfall is still weeks away.
See your cash quarter before it happens
Guessing at whether next month’s inventory order will clear is a stressful way to run a store. The 13-Week Cash Flow Forecast lays out your weekly cash in and cash out, carries each week’s closing balance into the next, and flags the week your cash gets tight while there’s still time to act. Fill in your receipts and payments, and read the runway.
