
Your contribution margin ratio (CMR) is the percentage of each sale left after variable costs — the same money as your dollar contribution margin, turned into a percentage so you can compare it across price points, SKUs, and channels. This guide covers how to calculate it, what a good one looks like in ecommerce, and the levers that move it.
Two products can throw off the same 60% and mean very different things for your business. The ratio is how you rank them on equal footing, set a target you can defend, and work out the sales you need to break even.
We’ll build the number from a single SKU, benchmark it against real ecommerce ranges, then walk the six levers that raise it.
How to calculate the contribution margin ratio
The contribution margin ratio is your contribution margin divided by sales revenue, times 100. Contribution margin is revenue minus every variable cost of the sale, so the ratio tells you the share of each dollar left to cover fixed costs and profit once the costs that scale with volume are paid.
| Contribution margin ratio = (contribution margin ÷ sales revenue) × 100 |
You can run it two ways and land on the same number. Per unit, divide one product’s contribution by its price. Across the business, divide total contribution margin by total revenue. The per-unit form answers whether a single SKU is worth selling; the total form tells you how healthy the whole book is.
It’s the percentage form of the dollar contribution margin covered in the contribution margin pillar.
The formula, worked on a real SKU
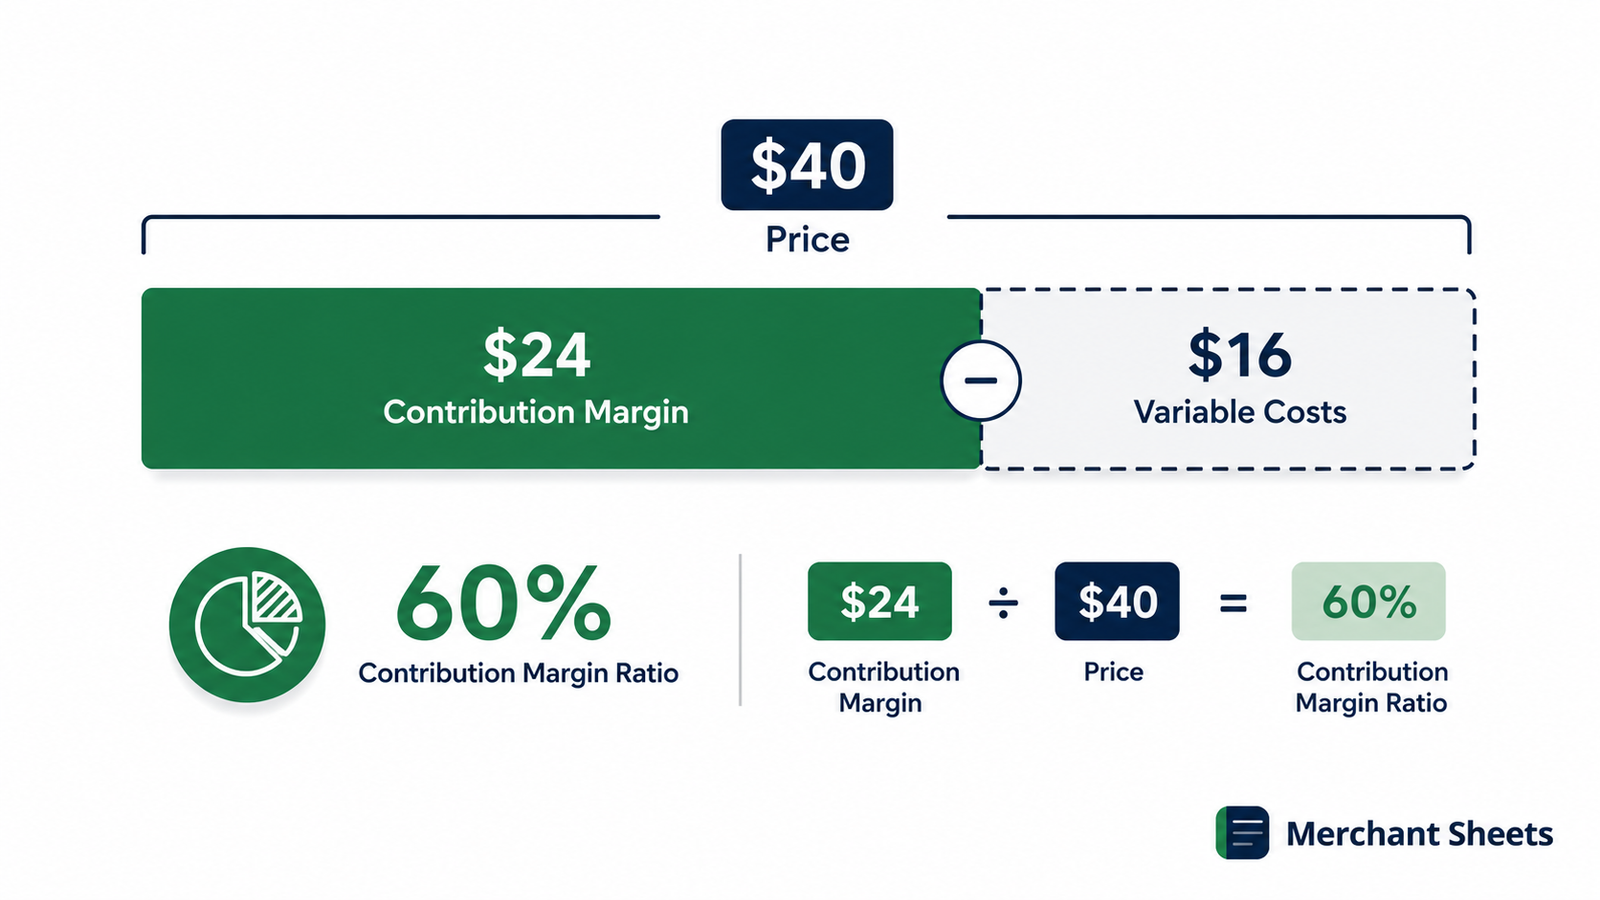
Take a product that sells for $40 with $16 of variable cost — cost of goods, payment fees, and pick-pack-ship. Its contribution margin is $24, and its ratio is $24 ÷ $40 = 60%. Every $40 order leaves $24 to cover overhead and profit.
Contribution margin ratio on a $40 order
| Line item | Per order |
|---|---|
| Sale price | $40.00 |
| Variable cost | ($16.00) |
| Contribution margin | $24.00 |
| Contribution margin ratio | 60% |
Run it on the total form and you get the same answer. Sell 100 of these and you book $4,000 in revenue, $1,600 in variable cost, and $2,400 in contribution — and $2,400 ÷ $4,000 is 60% again. The ratio holds whether you look at one order or a thousand, which is what makes it portable.
Keep the two figures distinct as you go: $24 is your contribution margin, 60% is your contribution margin ratio, and blurring a dollar figure with a percentage is how pricing decisions go wrong.
Why use the ratio instead of the dollar figure?
The dollar figure tells you what one sale contributes; the ratio tells you how efficiently it does so. That matters the moment you compare products at different price points.
A $40 product with $24 of contribution and a $10 product with $6 of contribution both run a 60% ratio. In dollars they look nothing alike; as a ratio they earn identically per dollar of revenue. Rank your catalog by the ratio and you see which SKUs pull their weight regardless of price, which is the comparison a raw dollar figure can’t give you.
For the dollar contribution margin and the CM1/CM2/CM3 ladder behind it, start with the contribution margin guide.
Contribution margin ratio vs gross margin ratio
The two ratios subtract different costs. Gross margin ratio takes out only your cost of goods sold. Contribution margin ratio takes out every variable cost of the sale: COGS plus payment fees, pick-pack-ship, shipping, and per-order ad cost.
On our $40 product, say COGS is $10 and the other variable costs total $6. Gross margin ratio is ($40 − $10) ÷ $40 = 75%. Contribution margin ratio is ($40 − $16) ÷ $40 = 60%. Gross margin flatters the product; the contribution margin ratio shows what’s left once the real cost of fulfilling the order is in.
Gross margin is the right lens for the income statement. The contribution margin ratio is the right lens for product and channel decisions, because it counts the costs that move when you sell one more unit. For a full side-by-side, see how it differs from gross margin ratio.
What counts as a variable cost?
A variable cost rises and falls with each order; a fixed cost stays put whether you sell ten units or ten thousand. Most variable costs are unambiguous, though a few sit on the fence — warehouse labor is part-fixed, and software fees stay flat until a per-seat or per-order tier kicks in.
Treat the clearly volume-driven costs as variable and keep the judgment calls consistent month to month. For a typical ecommerce brand, the variable bucket is:
- Cost of goods sold: The unit cost of the product itself, including inbound freight and duty to your warehouse.
- Payment processing: The percentage and per-transaction fee every checkout takes, usually around 2.9% plus $0.30.
- Pick, pack, and ship: The warehouse or 3PL cost to assemble and label each order.
- Outbound shipping: What the carrier charges to deliver, net of what the customer pays at checkout.
- Per-order ad cost: Marketing spend attributed to the sale, when you allocate acquisition cost at the order level.
What’s a good contribution margin ratio for ecommerce?
There’s no universal good contribution margin ratio — it depends on your business model and category. As a rough guide (as of early 2026), direct-to-consumer brands run 30–40%, subscription businesses 40–60%, marketplaces 15–25%, and luxury lines 60%+.
Typical contribution margin ratio by ecommerce model (as of early 2026)
| Business model | Typical CM ratio |
|---|---|
| Direct-to-consumer (DTC) | 30–40% |
| Subscription | 40–60% |
| Marketplace | 15–25% |
| Luxury / premium | 60%+ |
Category pulls the number too. Food and beverage tends to run 20–40%, fashion and apparel 50–70%, and beauty and supplements 60–80%, driven by how cheap the product is to make relative to its price.
Use these as a sanity check rather than a target. The number that matters most is your own trend — a ratio climbing two points a quarter beats a flat one that started higher.
Watch the level you measure at, too: once you allocate ad spend, a contribution margin ratio of 20% is the floor most brands need to scale on paid, and 35%+ gives real room to bid.
Using the ratio to find your break-even point
The contribution margin ratio tells you the revenue you need to cover fixed costs. Divide your fixed costs by the ratio and you get your break-even sales.
| Break-even revenue = fixed costs ÷ contribution margin ratio |
If your fixed costs run $30,000 a month and your blended contribution margin ratio is 60%, you break even at $30,000 ÷ 0.60 = $50,000 in monthly revenue. Every dollar above that contributes 60 cents to profit. Lift the ratio to 65% and your break-even drops to about $46,150 — the same overhead, covered by less revenue.
The ratio also sets the ceiling on what you can spend to win a customer, so pair it with your break-even point on ad spend to turn the percentage into a spending limit.
How to improve your contribution margin ratio
Two things move the ratio: more revenue per order, or less variable cost per order. Every point you add flows straight to the bottom line, because the ratio sits above your fixed costs. Here are the levers, roughly in order of impact for most ecommerce brands:
- Raise price or cut discounting: The fastest lever when you have pricing power, since a 5% price increase drops almost entirely to contribution. Test it on your least price-sensitive SKUs first.
- Lower cost of goods: Negotiate supplier terms, order in larger runs, or re-source components. Even a small unit-cost cut compounds across every order you ship.
- Trim variable fulfillment: Renegotiate 3PL rates, right-size packaging, and tune shipping zones. These costs hide in plain sight and rarely get audited.
- Shift mix toward higher-ratio SKUs: Feature and bundle the products that already carry the best ratio. You improve the blended number without touching a single cost.
- Lower per-order ad cost: Bring customer acquisition cost (CAC) down through sharper targeting, or lift average order value so the same spend covers more revenue.
- Reduce returns: Every return erases the contribution on the original order and adds return shipping. Better sizing guides and product photos pay for themselves.
See the ratio by channel
A single blended contribution margin ratio hides as much as it shows. When you average every channel into one number, a thriving email segment can mask a marketplace that loses money on each order, and you’d never know which one to fix. The ratio earns its keep when you read it per channel.
Our Contribution Margin by Channel template calculates the ratio for each channel automatically — drop in your revenue and variable costs, and it shows where the money’s made and where it leaks, updated every time you refresh the numbers.
Start with the SKU-level math above, then move to the channel view when a blended number stops telling you enough.
Frequently asked questions
Can the contribution margin ratio be over 100%?
No, 100% is the ceiling, reached only if a product had zero variable cost, which isn’t realistic for a physical business. The ratio can go negative, though: when a product’s variable costs exceed its price, you lose money on every unit and the ratio drops below zero.
What's a good contribution margin ratio for ecommerce?
A good contribution margin ratio depends on your model — roughly 30–40% for DTC, 40–60% for subscription, and 15–25% for marketplaces as of early 2026 — but the more useful test is whether your own ratio is trending up. After you allocate ad spend, most brands need at least 20% to scale on paid, and 35%+ to bid aggressively.
Is the contribution margin ratio the same as gross margin?
No — the contribution margin ratio subtracts every variable cost of a sale, while gross margin subtracts only the cost of goods sold. That’s why the same product almost always shows a lower contribution margin ratio than gross margin, since fees, fulfillment, shipping, and ad cost all come out first.
How do you use the contribution margin ratio to find break-even?
Divide your fixed costs by the contribution margin ratio to get the revenue you need to break even. At $30,000 of monthly fixed costs and a 60% ratio, you break even at $50,000 in sales, and every dollar beyond that adds 60 cents of profit.
