
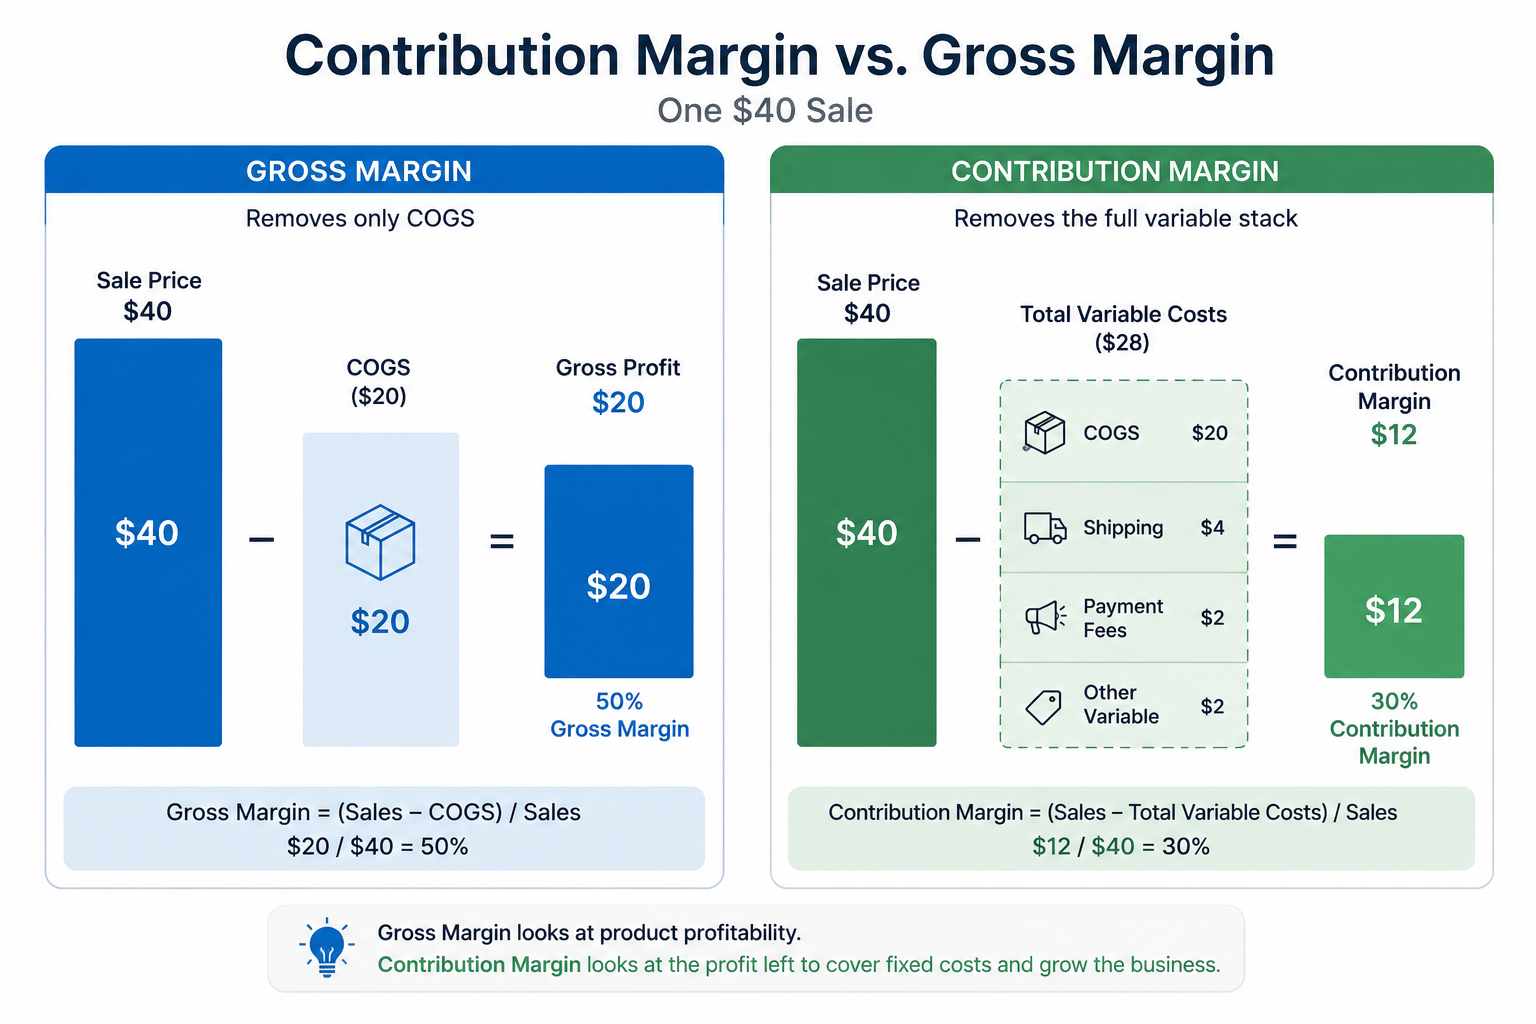
Gross margin and contribution margin both measure what’s left after costs, but they subtract different costs and answer different questions. Gross margin asks whether a product is worth making. Contribution margin asks whether it’s worth selling through a given channel at a given acquisition cost.
Mixing them up leads to real mistakes — pricing off a number that ignores your shipping and ad costs, or judging a channel on a metric built for the income statement. This guide settles the difference on a single SKU, answers which one comes out higher, and gives you a rule for when to use each.
Contribution margin vs gross margin, in one line
Gross margin subtracts only your cost of goods sold (COGS). Contribution margin subtracts every variable cost of the sale — COGS plus payment fees, fulfillment, shipping, and per-order ad cost. Both are usually shown as a percentage of revenue, so the contribution margin captures costs that gross margin leaves out.
How the two metrics compare
| Metric | What it subtracts | What it answers |
|---|---|---|
| Gross margin | COGS only | Is the product worth making? |
| Contribution margin | All variable costs of the sale | Is it worth selling through this channel? |
What gross margin measures
Gross margin is revenue minus COGS, divided by revenue. COGS is the direct cost of the product itself: materials and the inbound freight and duty to get it to you. In traditional cost accounting, COGS also absorbs a share of fixed production overhead, which matters for the higher-or-lower question below.
On a product that sells for $40 with $10 of COGS, gross margin is ($40 − $10) ÷ $40 = 75%. That 75% is the money left to cover everything else — fulfillment, ads, overhead, and profit. Gross margin is the standard profitability line on your income statement, and it’s what investors and lenders read first.
One naming note: gross profit is the dollar figure ($30 here), and gross margin is that same number as a percentage of revenue (75%). Contribution margin works the same way — a dollar figure with a percentage twin, the contribution margin ratio. Keep the dollars and the percentages labeled so you never compare one against the other.
What contribution margin measures
Contribution margin is revenue minus every variable cost of the sale, divided by revenue. A variable cost is any cost that rises and falls with each order. For an ecommerce brand, that bucket runs wider than COGS alone:
- Cost of goods sold: The product cost plus inbound freight and duty.
- Payment processing: The checkout fee on each order, usually around 2.9% plus $0.30.
- Fulfillment and shipping: Pick-pack-ship and the outbound carrier cost, net of what the customer pays.
- Per-order ad cost: Acquisition spend attributed to the sale, when you allocate it at the order level.
On the same $40 product, add $6 of these costs to the $10 of COGS and your variable total is $16. Contribution margin is ($40 − $16) ÷ $40 = 60%. For the dollar version of this number and the CM1/CM2/CM3 ladder behind it, see the contribution margin guide.
The difference on one SKU
Put both on the same product and the gap is easy to see. Gross margin stops after COGS; contribution margin keeps going through the variable costs of fulfilling and selling the order.
Gross margin vs contribution margin on a $40 order
| Line item | Amount | % of price |
|---|---|---|
| Sale price | $40.00 | 100% |
| Cost of goods sold | ($10.00) | 25% |
| = Gross margin | $30.00 | 75% |
| Other variable costs (fees, shipping, ads) | ($6.00) | 15% |
| = Contribution margin | $24.00 | 60% |
The 15-point gap between 75% and 60% is where the real cost of selling lives — the fees, shipping, and ad spend that gross margin never sees. On a product with heavy fulfillment or a high acquisition cost, that gap gets wider, which is why a strong gross margin can still hide a thin or negative contribution.
Two products can post an identical gross margin and contribute completely different amounts. Take two SKUs that both sell for $50 with $15 of COGS, so both show a 70% gross margin. One is light and sells organically; the other is bulky and bought through paid ads:
Same 70% gross margin, very different contribution
| Product A | Product B | |
|---|---|---|
| Sale price | $50.00 | $50.00 |
| COGS | ($15.00) | ($15.00) |
| = Gross margin | 70% | 70% |
| Other variable costs | ($5.00) | ($22.00) |
| = Contribution margin | $30.00 (60%) | $13.00 (26%) |
Gross margin rates them as equals. Contribution margin shows Product B keeping less than half as much per sale once its shipping and ad cost are in. Price or scale the two the same way and Product B quietly drags on profit. This is the decision gross margin can’t make for you.
What getting the two mixed up costs you
The mix-up shows up in two decisions most: discounts and channel bets. Both can look fine through gross margin while quietly draining contribution.
Take 20% off that $40 product and the price falls to $32. Gross margin only dips from 75% to about 69% — still healthy on paper. But contribution takes the full $8 hit: it drops from $24 to $16, a third less profit on every order, and the ratio falls from 60% to 50%.
Your fixed costs haven’t moved, so that lost contribution comes straight off the bottom line. Judge the promo on gross margin and it reads as safe; judge it on contribution and you see how much thinner each sale just got.
Channel decisions spring the same trap. A marketplace with high fees and paid traffic can post a respectable gross margin and a contribution margin near zero. Gross margin says keep scaling; contribution margin says you’re buying revenue at cost. The metric you choose decides whether you double down or pull back.
Is contribution margin higher or lower than gross margin?
It depends on what’s inside your COGS, which is why you’ll find both answers online. The two framings come from different starting points, and reconciling them clears up most of the confusion.
For a typical direct-to-consumer brand, COGS is product plus inbound freight, with little to no fixed overhead loaded in. Contribution margin then subtracts extra variable selling costs (fees, shipping, ads) that gross margin ignores, so it lands lower. That’s our $40 example: a 75% gross margin and a 60% contribution margin.
Cost-accounting textbooks often show the reverse. There, COGS already carries a share of fixed manufacturing overhead, and contribution margin strips that fixed cost back out because it counts only variable costs. When COGS is inflated by fixed overhead, contribution margin can land higher than gross margin.
The direction flips on whether fixed costs sit inside your COGS.
| Which is higher depends on what’s inside your COGS. For a DTC brand whose COGS is product plus freight, contribution margin is the lower number. |
Where these margins sit in the P&L
Gross margin and contribution margin are two rungs on the same ladder. Start at revenue, subtract costs in layers, and each layer gives you a different margin. Seeing the full stack makes clear why the two get confused — they sit right next to each other.
The margin stack, top to bottom
| Margin | Reached by subtracting |
|---|---|
| Gross margin | COGS |
| Contribution margin | COGS + all other variable costs |
| Operating margin | the above + fixed operating costs (overhead) |
| Net margin | the above + interest and taxes |
Gross margin and contribution margin are the two closest rungs, separated only by your variable selling costs. Operating and net margin then layer in fixed overhead, interest, and tax to reach bottom-line profit. Gross and contribution margin are the two you’ll reach for most in day-to-day product and channel decisions.
When to use each
Both metrics earn their keep; they answer different questions. Gross margin is your reporting and product-viability lens, while contribution margin drives your break-even and, as the contribution margin ratio, lets you compare products and channels on equal footing. Match the metric to the decision:
- Use gross margin to: Judge whether a product is fundamentally worth making and to report profitability on your P&L. It’s the standard line investors and lenders expect to see.
- Use contribution margin to: Make pricing, channel, and ad-spend calls. It’s the number that tells you whether one more order at a given acquisition cost adds profit or quietly loses money.
Why break-even runs on contribution margin
Break-even is the clearest reason the distinction matters. You cover fixed costs out of contribution margin, not gross margin, so your break-even point is built on the contribution figure.
| Break-even revenue = fixed costs ÷ contribution margin ratio |
At $30,000 of monthly fixed costs and a 60% contribution margin ratio, you break even at $30,000 ÷ 0.60 = $50,000 in sales. Run the same math on the 75% gross margin and you’d get $40,000 — a target that ignores the fees, shipping, and ad spend between you and profit, and sets your break-even $10,000 too low.
Use gross margin here and you’ll think you’re profitable well before you are. This is where reading contribution margin, and its break-even, keeps the decision honest.
Use the right margin for the decision
Once you know which metric fits which decision, the next step is reading contribution margin where it matters most — per channel, where a blended number hides which one carries the business and which one leaks. Gross margin won’t show you that; contribution margin will.
Our Contribution Margin by Channel template calculates the contribution margin for each channel automatically, so you can see where the money’s made without rebuilding the math each month. Start with the distinction above, then move to the channel view when you’re ready to act on it.
Frequently asked questions
What's the difference between contribution margin and gross margin?
Gross margin subtracts only the cost of goods sold, while contribution margin subtracts every variable cost of a sale — COGS plus payment fees, fulfillment, shipping, and per-order ad cost. Gross margin measures product-level profitability for reporting; contribution margin measures what a sale leaves to cover fixed costs and profit.
Is contribution margin higher or lower than gross margin?
It depends on what’s inside your COGS. For a direct-to-consumer brand whose COGS is product plus freight, contribution margin is lower, because it subtracts extra variable selling costs that gross margin ignores. In cost accounting, where COGS carries fixed overhead, contribution margin can be higher, since it strips that fixed cost back out.
Which should I use, contribution margin or gross margin?
Use gross margin to judge product viability and report profitability, and use contribution margin to make pricing, channel, and ad-spend decisions. Gross margin is the income-statement view; contribution margin is the decision view, because it counts the costs that move when you sell one more unit.
Does gross margin include shipping and ad spend?
No, gross margin subtracts only the cost of goods sold, so outbound shipping, fulfillment, payment fees, and ad spend all sit below it. Those are the variable selling costs contribution margin captures, which is why the same product shows a lower contribution margin than gross margin.
Can contribution margin and gross margin be the same?
Yes — they match when the only variable cost of a sale is COGS and that COGS carries no fixed overhead. It’s rare in ecommerce, where payment fees, shipping, and ad spend almost always drive contribution margin below gross margin.
Is contribution margin the same as gross profit?
No, gross profit is revenue minus COGS, the dollar version of gross margin, while contribution margin subtracts every variable cost of the sale. Both are dollar figures, but contribution margin is the smaller one for most ecommerce brands, since it also removes payment fees, shipping, and ad spend.
