
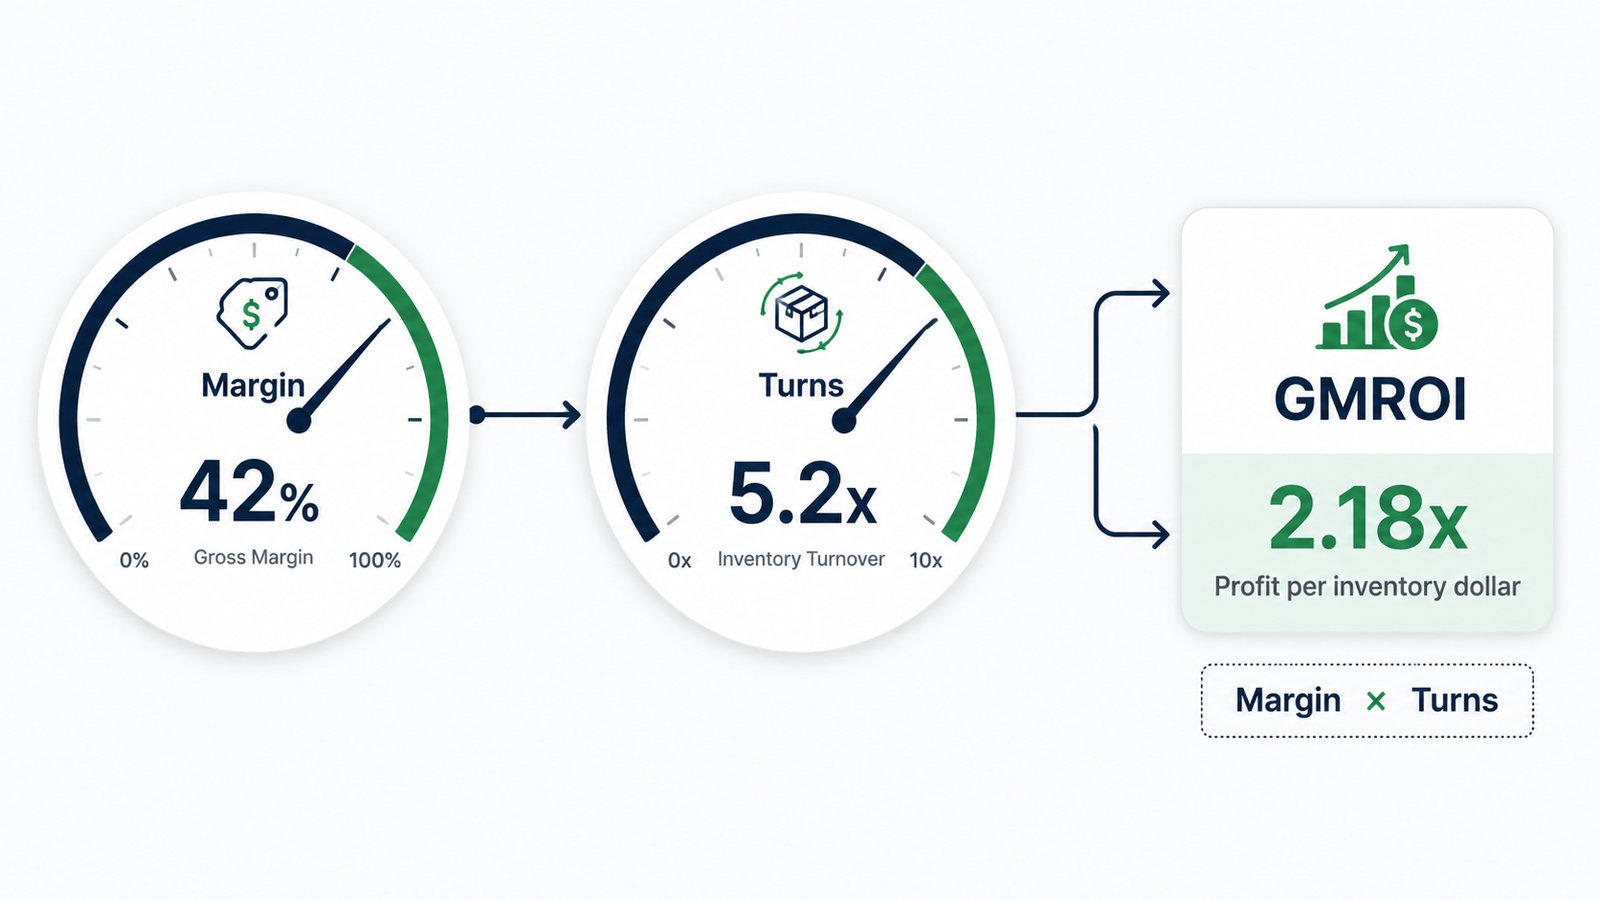
Inventory turnover tells you how fast a product sells. Gross margin tells you how much you keep when it does. On their own, each hides half the picture: a SKU can spin fast on a thin margin and earn almost nothing, or carry a fat margin and sit on the shelf for a year. GMROI puts both on the same line.
Gross margin return on investment (GMROI) measures the gross profit you earn for every dollar tied up in inventory. It’s the number that ranks products by how hard their stock dollars work, so you know which ones deserve a bigger reorder and which are quietly draining cash.
This guide covers the formula, how to read it at the SKU level, category benchmarks, and the levers that move it.
What is GMROI?
GMROI is the gross profit a business earns for each dollar of inventory it carries at cost. A GMROI of 2.0 means every $1 sunk into stock returns $2 in gross margin over the period. Above 1.0, your inventory earns back more than it cost to carry. Below 1.0, it’s losing money on the shelf.
You’ll sometimes see it written as GMROII, gross margin return on inventory investment, which is the same metric. It comes out of retail merchandising, where buyers use it to split a fixed inventory budget across products that sell at different speeds and margins.
The same logic fits any ecommerce catalog where cash is finite and every SKU competes for it. Because the metric works at the level of a single SKU, a category, or the whole business, it scales from one product decision up to a full assortment review.
The GMROI formula
The formula divides your gross profit by what you paid to hold the stock that produced it:
GMROI = Gross Margin $ ÷ Average Inventory (at cost)
Two inputs, and both need care. Gross margin is your revenue minus cost of goods sold (COGS) over the period, expressed as a dollar figure rather than a percentage. Average inventory at cost is the average value of the stock you held, valued at what you paid for it.
Value inventory at cost, not retail. Dividing gross margin by inventory priced at its selling value is the most common GMROI mistake, and it deflates the ratio so that healthy SKUs look weak.
Two ways to find average inventory
How you average your inventory matters more than it looks, because a single snapshot can misrepresent a year of stock. The quick method takes your beginning and ending inventory at cost and divides by two. It’s fine for a steady catalog, but it ignores everything that happened in between.
The more accurate method averages your month-end inventory values across the period. Add the twelve month-end figures plus the opening balance and divide by 13. For a seasonal brand that builds stock before a peak and draws it down after, this monthly average tells the truth where a two-point average would either flatter or punish the result.
Keep the period consistent either way: a full year of gross margin belongs against a full year of average inventory, never a single month’s snapshot.
A worked example
Say a product line brings in $300,000 in revenue against $120,000 in COGS. That’s $180,000 in gross margin. You started the year holding $80,000 in inventory at cost and ended with $100,000, so your average inventory is $90,000.
Divide $180,000 by $90,000 and the line runs a GMROI of 2.0. For every dollar it kept in stock, it generated two dollars of gross profit.
If that same line held twice the stock to hit the same sales, its average inventory would jump to $180,000 and its GMROI would halve to 1.0, which is how overstocking shows up in the metric even when revenue holds steady.
How does GMROI tie margin to turnover?
GMROI works because it multiplies margin and turnover together instead of averaging them. Written out, the metric equals your margin-on-cost times your inventory turns, so both levers pull on the result.
That’s why two products can post the same GMROI by opposite routes, and why the metric catches what turnover or margin alone would miss.
Look at four SKUs. The first pair turns at the same speed, yet lands miles apart on GMROI because their margins differ. The second pair reaches nearly the same GMROI from opposite directions: one wins on margin, the other on velocity.
GMROI for four SKUs (margin-on-cost x inventory turns).
| SKU | Gross margin | Inventory turns | GMROI | What it shows |
| A — premium apparel | 60% | 4.0x | 6.0 | Fat margin does the work |
| B — commodity basics | 30% | 4.0x | 1.7 | Same speed, a third of the return |
| C — margin-led | 65% | 3.0x | 5.6 | Slow, but rich enough to win |
| D — velocity-led | 40% | 8.0x | 5.3 | Thinner margin, made up on turns |
SKU A and SKU B turn four times a year each, so a turnover report would rank them as equals. Their GMROI says otherwise: A returns $6 of margin per inventory dollar, B returns $1.70. Meanwhile C and D end up close together despite one turning at 3x and the other at 8x.
Watch only inventory turns and you’d fund the fast mover and starve the margin-rich SKU that earns just as much.
What’s a good GMROI?
A good GMROI depends on your category, but the general rule of thumb holds across retail: below 1.0 loses money on inventory, 2.0 to 3.0 is a solid result, and above 3.0 is strong in most verticals. Investopedia and Shopify both put the healthy band around 2 to 3 for a typical retailer, with roughly 3.2 counting as a standout.
The band shifts with the economics of what you sell. High-margin, fast-moving goods like beauty can clear 4 or 5, while capital-heavy, slow-selling categories like fine jewelry sit closer to 1.5 and still run a healthy business.
The numbers below are typical ranges reported across retail categories as of early 2026; treat them as a starting reference and confirm against your own vertical.
Typical GMROI ranges by retail category (as of early 2026).
| Category | Typical GMROI | Why it lands there |
| Health & beauty | ~2.7 – 5.2 | High margin plus quick rotation |
| Home & furniture | ~2.1 – 4.4 | Wide spread; bulky, slow stock at the low end |
| Fashion & apparel | ~2.2 – 3.0 | Decent margin, seasonal velocity |
| Sporting goods | ~1.9 – 2.2 | Moderate margin and turns |
| Footwear | ~1.8 – 2.0 | Tighter margins, slow non-core sizes |
| Jewelry | ~1.1 – 1.8 | Cash locked in slow, high-cost pieces |
The practical move is to compare a SKU against its own category and against your own history, rather than a blended average. A 2.2 is a good showing in furniture and a warning sign in health and beauty, so the same number means different things depending on what’s on the shelf.
How do you read GMROI at the SKU level?
GMROI earns its keep per SKU, where it tells you which products deserve more of a finite inventory budget and which are absorbing it. Run the same formula on each SKU’s gross margin and average inventory, then sort the catalog from highest GMROI to lowest. The ranking turns an abstract ratio into a short list of decisions.
The top of the list is where your cash works hardest: protect availability on those SKUs, since a stockout there costs you your most efficient margin. The middle usually holds high-margin, slow-turning items, worth keeping but not worth overstocking. The bottom is where the money leaks.
A SKU with a low GMROI has three exits before you give up on it. Reprice it if the market gives you room, renegotiate its landed cost with the supplier, or cut the order quantity so less cash sits idle against the same sales.
When none of those moves the number, that’s the signal for SKU rationalization, the merchandising term for pruning a product that no longer earns its place in the assortment. GMROI gives that call a number instead of a hunch.
How to improve GMROI
GMROI rises out of disciplined inventory planning, and because it’s margin times turnover over the stock you carry, you can push it three ways. Watch the whole ratio while you pull any single lever, since a win on one axis can quietly cost you on another.
The three levers
Each lever targets a different part of the formula. Weigh the cost of each against the return it buys and the cash it frees:
- Lift margin: Reprice where the market allows, negotiate landed cost down, or shift the mix toward higher-margin SKUs. Every point of margin flows straight through to GMROI.
- Turn faster: Sharpen your demand forecast, order in tighter quantities, and run promotions to clear slow movers. More turns on the same stock lifts the return.
- Carry less idle stock: Clear dead stock before it ages, and trim safety stock by tightening supplier lead time. A smaller denominator raises GMROI even when margin and sales hold flat.
Mind the trade-offs
The levers interact, and the naive version of each can backfire. Deep markdowns to force turnover cut the margin half of the formula, so a fire sale that doubles velocity while halving margin leaves GMROI exactly where it started.
Raising prices to lift margin can slow sales enough that the stock ages into dead stock, which hurts the return you were chasing.
The formula also leaves out holding costs on purpose. It measures return on the purchase cost of inventory, not the storage, insurance, and capital costs of keeping it around. A SKU with an acceptable GMROI but heavy holding costs can still be a poor use of cash, so read the metric next to your carrying costs rather than in isolation.
When you do need to clear dead stock, bundling it with fast movers, running a clearance, or donating it for a write-off all free up the denominator faster than letting it sit.
GMROI vs. inventory turnover vs. days inventory on hand
These three metrics answer related questions, so it helps to keep them straight. Inventory turnover counts how many times you sell through your average stock in a period.
Days inventory on hand takes that same speed and states it in days, showing how long stock sits before it sells. GMROI adds the missing dimension: it weights that speed by how profitable each turn is, per dollar invested.
Reach for turnover and days on hand when you’re managing stock flow and cash cycle. Reach for GMROI when you’re deciding where inventory dollars earn their keep, which is a profitability question rather than a speed one.
Read alongside your other ecommerce KPIs, GMROI is the one that tells you whether fast-moving stock is also worth moving.
Rank your catalog by GMROI
Running GMROI once is easy; running it across a growing catalog, every month, is where it turns into a chore. Each SKU needs its cost, price, and stock value pulled together before the ranking means anything.
The Inventory Management Base holds all three per SKU, computes on-hand value, days of cover, and ABC tier, and surfaces which products are tying up the most cash, in Excel or Google Sheets. Set up your stock position once and let the sheet show you where your inventory dollars are working hardest.
Frequently asked questions
What is a good GMROI?
A good GMROI is generally 2.0 to 3.0, with anything above 3.0 counting as strong across most retail categories and anything below 1.0 signaling that inventory is losing money. The right target depends on your vertical: high-margin, fast-selling categories like beauty can clear 4 or 5, while slow, capital-heavy categories like jewelry run healthy nearer 1.5, so compare against your own category rather than a blanket benchmark.
What's the difference between GMROI and inventory turnover?
Inventory turnover measures how fast stock sells, while GMROI measures how much gross profit that stock earns per dollar invested. Turnover ignores margin, so a fast-selling, low-margin SKU can look great on turns and still earn little; GMROI folds margin back in, which is why two products with identical turnover can post very different GMROI.
How do you calculate GMROI?
You calculate GMROI by dividing gross margin dollars by average inventory valued at cost, where gross margin is revenue minus COGS and average inventory is the beginning plus ending inventory cost divided by two. For example, $180,000 of gross margin against $90,000 of average inventory at cost gives a GMROI of 2.0.
Is GMROI calculated at cost or retail?
GMROI values the inventory in the denominator at cost, not at retail, because the metric measures return on the dollars you invested to buy the stock. Using the retail value inflates the denominator and understates the ratio, which is the single most common error people make when they first run the calculation.
How often should you calculate GMROI?
Calculate GMROI at least quarterly, and monthly for fast-moving or short-shelf-life products where demand and stock levels swing enough to change the picture between quarters. An annual figure suits a stable catalog, but it can hide a SKU that turned profitable or went cold partway through the year, which is exactly the timing a reorder decision needs to catch.
How does seasonality affect GMROI?
Seasonality distorts GMROI when a sales spike or a pre-season inventory build lands unevenly across the period, since the metric divides a full period’s margin by average stock. Use a monthly average inventory rather than a two-point average for seasonal catalogs, and compare each season against the same season last year rather than against the quarter before it.
What does a GMROI below 1 mean?
A GMROI below 1 means a product returns less gross margin than the cost of the inventory tied up to sell it, so those stock dollars are eroding rather than earning. It’s a signal to reprice, renegotiate cost, cut the order quantity, or discontinue the SKU before it drags on cash any longer.
