
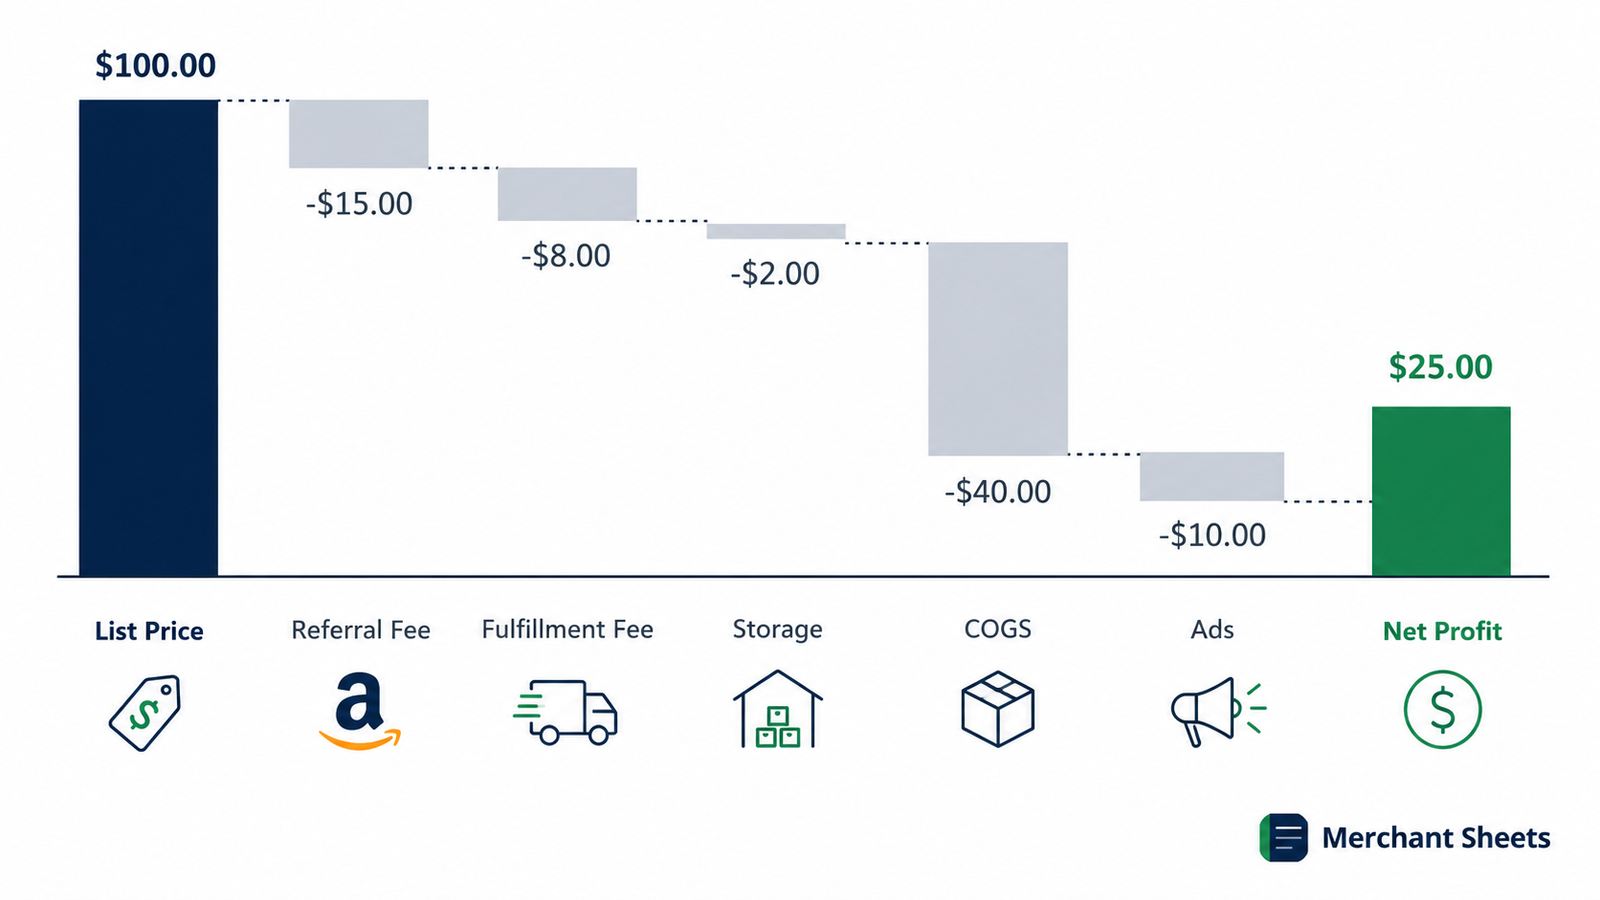
The price you list at isn’t the money you keep. Between Amazon’s referral fee, the FBA fulfillment fee, storage, and the returns you’ll eat, a chunk of every sale disappears before the payout lands in your account. Run the numbers wrong and a product that looks profitable on the shelf quietly loses money on every order.
An honest Amazon profit calculator strips all of that out and shows you what’s left per unit — your real margin.
This guide walks through every deduction between the sale and the deposit, shows the math on one worked example, and gives you the healthy-margin ranges to price against.
The fee figures below move, so treat them as a starting point and pull your live numbers from Seller Central before you commit to a price.
When you’re ready to run it across a whole catalog instead of one SKU at a time, I’ve built the calculator that does it.
How do you calculate FBA profitability?
FBA profitability is your sale price minus every cost tied to that sale: the product’s landed cost, Amazon’s referral fee, the FBA fulfillment fee, storage, returns, and the ad spend that won the order. Work it per unit. What’s left is your contribution per unit, and dividing that by the sale price gives your real margin.
The trap most sellers fall into is treating price minus product cost as margin. That number ignores the stack of platform fees that only show up on your settlement report, so it overstates profit — often by a wide margin on low-priced items where fixed fulfillment fees eat a large share of the sale.
The fix is to account for each deduction on its own line, which is exactly what the sections below do.
The fees that come out of every sale
Three Amazon fees hit nearly every FBA order, and a fourth hits slow-moving stock. Each is charged on its own basis, so you can’t fold them into one blended percentage. Amazon publishes the Amazon FBA fees in full; the table below covers the ones that shape your margin.
Rates move, so pull your live numbers from Seller Central before you price — our calculator ships with the current schedule built in.
Table 1: The Amazon fees that reduce your per-unit profit (rates change — verify in Seller Central, as of early 2026).
| Fee | What it is | How it’s charged (as of early 2026) |
|---|---|---|
| Referral fee | Amazon’s commission on the sale | 15% of the sale price for most categories (8–20% on some), with a $0.30 minimum |
| FBA fulfillment fee | Pick, pack, and ship per unit | A flat fee by size and weight tier: roughly $3.06–$6.68 for standard-size units, more for bulky and oversize |
| Monthly storage fee | Warehouse space your stock occupies | $0.87 per cubic foot January–September, rising to $2.40 October–December for standard-size |
| Long-term storage fee | Surcharge on stock that sits too long | An added charge once inventory passes the aged-inventory threshold |
| Returns processing | Handling and restocking on returned units | Varies by category; weight it by your return rate |
The costs sellers forget
Amazon’s fees are the obvious deductions. The ones that quietly sink margin are the costs sellers leave out of the math because they don’t appear on the fee schedule.
- Landed cost, not supplier price: Your true cost per unit stacks freight, duty, and inbound shipping on top of the factory invoice. Work from your full landed cost so the margin sits on a real base.
- Returns and reimbursement leakage: A returned unit costs you the return fee, often the product itself, and the reship. On categories with high return rates, this line alone can turn a thin-margin SKU negative.
- Ad cost per unit: Most FBA sales are won with PPC, so your break-even depends on ad efficiency. Fold the ad cost per unit into the math and watch your break-even ACoS to keep it honest.
- Prep and inbound shipping: Labeling, poly-bagging, and freight to Amazon’s warehouse are real per-unit costs. Small on their own, they add up on low-price products.
A worked example: one SKU, start to finish
Here’s the full walk-down on an example product — a $29.99 Home & Kitchen item, Large Standard size at 1–2 lb, that costs $6.00 landed. The fee figures come from the current Amazon schedule; swap in your own SKU’s tier before you rely on them.
Watch how a sale that looks like a $24 gross profit lands under $10 once every deduction clears.
Table 2: Illustrative per-unit profit walk-down for a $29.99 FBA product (example figures — verify fees before use).
| Line | Amount | Running total |
|---|---|---|
| Sale price | $29.99 | $29.99 |
| Referral fee (Home & Kitchen, 15%) | −$4.50 | $25.49 |
| FBA fulfillment fee (Large Standard, 1–2 lb) | −$4.55 | $20.94 |
| Landed product cost | −$6.00 | $14.94 |
| Storage + returns allowance | −$1.50 | $13.44 |
| Ad cost per unit (example) | −$4.00 | $9.44 |
| Net profit per unit | $9.44 | — |
| Real margin | 31% | — |
On paper this SKU carried a $24 gross profit above product cost. After Amazon’s fees, storage, returns, and ads, the real margin is 31% and the net profit is $9.44 — a healthy result here, but a long way from the $24 the sticker math implied. That gap is the whole point of running the calculation.
| List price minus product cost isn’t your margin. On FBA, your real profit is what’s left after Amazon’s referral and fulfillment fees, storage, and returns — often 30–50% lower than the number sellers quote from price and cost alone. Ad spend takes it lower still. |
What good FBA margin looks like
A healthy net margin on a mature FBA product tends to land in the 15–30% range after all fees and ads, though it varies widely by category and price point.
Higher-priced items absorb the flat fulfillment fee more easily and often clear more; sub-$15 products fight a hard battle, because fixed fees and returns take a big bite of a small sale.
The margin killers are consistent: thin products die on returns and ad spend, the two costs that scale with volume and rarely improve on their own.
Before you launch or hold a SKU, work out the break-even price for your target margin — the price at which the unit clears every cost and still leaves the profit you need. If your market won’t bear that price, the product doesn’t work on FBA, and no amount of ad spend fixes that.
Keep the underlying idea in view: this is contribution margin applied to Amazon, and the same logic that governs a healthy DTC unit governs a healthy ASIN.
Price to keep your margin
Running this math by hand for every SKU is how thin-margin products slip through. The Amazon FBA Profitability Calculator takes your cost, price, and dimensions and returns real per-unit profit and margin after every Amazon fee — for your whole catalog in one view.
Frequently asked questions
What's a good FBA profit margin?
A net margin of 15–30% after all fees, returns, and ads is a healthy target for a mature FBA product, though it swings with category and price. Higher-priced items usually clear more because the flat fulfillment fee is a smaller share of the sale.
How are FBA fulfillment fees calculated?
Amazon charges a flat fulfillment fee per unit based on the product’s size and weight tier, not a percentage of price. That’s why low-priced, bulky items are hard to make work — the fixed fee eats a large share of a small sale. Confirm your current tier in Seller Central.
Is FBA or FBM cheaper?
It depends on your product’s size, weight, and turnover: FBA’s fulfillment and storage fees can beat your own shipping cost on small, fast movers, while heavy or slow items often cost less through merchant fulfillment. Our comparison of FBA or FBM walks through the break-even.
Does the FBA calculator include PPC?
Yes, ad cost per unit is one of the largest deductions on most FBA sales, so leaving it out overstates your margin. Our calculator lets you enter an ad cost or target ACoS per SKU so the profit figure reflects what you’re really spending to win the order.
