
Inventory planning is how you decide what to reorder, how much, and when — before a stockout or a pile of dead stock makes the call for you. Do it well and your cash keeps moving while your best sellers stay in stock. Do it poorly and you tie money up in the wrong products and lose sales on the right ones.
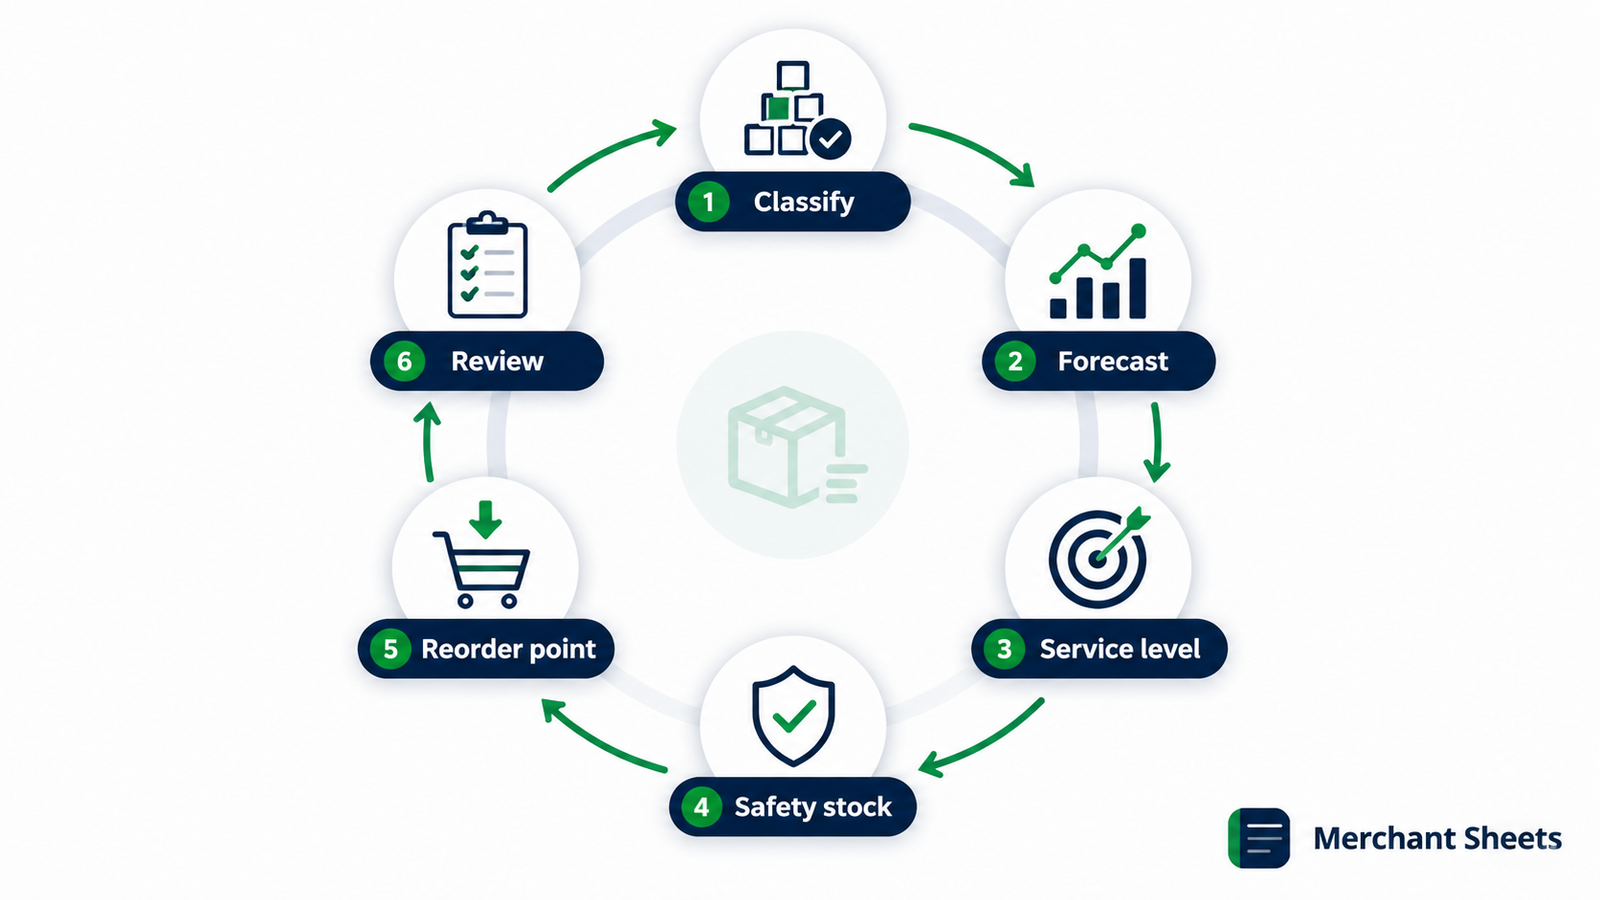
The work gets simpler once you treat it as a cycle you re-run on your own numbers. Each step feeds the next: you sort your catalog, forecast demand, decide how much risk to carry, then turn that into a buffer and a reorder date for every SKU.
We’ll cover all six steps, and point you to a deeper guide wherever one step deserves its own model.
What is inventory planning?
Inventory planning is the ongoing process of deciding which products to stock, how much of each to hold, and when to reorder, so you can meet demand without tying up more cash than you have to. It runs on your sales history and your supplier lead times, and you re-run it every planning cycle as those numbers change.
It’s easy to blur inventory planning with two neighbors.
Inventory management is the day-to-day handling — receiving, storing, counting, and picking the stock you already own.
Demand forecasting is one input into planning: the estimate of what you’ll sell. Planning is the decision layer on top. It takes the forecast, weighs your service goals against your cash, and outputs the orders.
Why does inventory planning matter for ecommerce?
Ecommerce runs on thin margins and long lead times, which makes every inventory mistake expensive. There are two ways to get it wrong, and they pull in opposite directions.
A stockout costs you the sale you were set up to make. On marketplaces it costs more than that: running out can sink a product’s search rank and stall its review momentum, so the damage outlasts the empty shelf.
Overstock is the quieter problem. Every unit you over-order is cash tied up in inventory instead of funding your next order or your ad spend, and if it doesn’t sell, it ages into markdowns.
Good planning keeps you between those two failures on purpose, instead of lurching from one to the other.
The inventory planning process in 6 steps
Here’s the full cycle. Each step hands its output to the next, and each has a deeper guide when you want to go further:
- Classify your SKUs so your attention goes where the revenue is.
- Forecast demand for each product or group.
- Set a service level that reflects how much stockout risk you’ll accept.
- Calculate safety stock to cover demand and lead-time swings.
- Set reorder points and order quantities.
- Review the plan on a cycle and adjust.
Step 1: Classify your SKUs with ABC analysis
Not every product deserves the same planning effort. ABC analysis sorts your catalog by how much revenue each SKU drives, so your tightest planning lands on the items that earn it. A-items are the vital few that bring in the bulk of your sales; C-items are the many that each contribute little; B-items sit in between.
A typical ABC breakdown for an ecommerce catalog.
| Tier | Share of SKUs | Share of revenue | How to plan it |
|---|---|---|---|
| A | 10–20% | 70–80% | Forecast individually, hold a high service level, review often |
| B | ~30% | 15–20% | Forecast in groups, moderate service level, review monthly |
| C | 50–60% | 5–10% | Simple reorder rule, low service level, review rarely |
Running it takes one sort. List every SKU with its revenue over the last twelve months, sort highest to lowest, and add a running total as a share of your total sales. The SKUs that stack up to roughly the first 80% are your A-items, the next 15% are your B-items, and the long tail that fills out the last 5% are your C-items.
Plan your A-items like they pay the bills, because they do, and put your C-items on a simple rule so they don’t eat time they don’t earn back.
Step 2: Forecast demand
A plan is only as good as the demand estimate under it. For most stores, a solid forecast starts with your trailing twelve months of unit sales, adjusted for seasonality and any known events — a promo, a new sales channel, a price change. That gives you an expected units-per-week or per-month for each SKU or group.
Seasonality is the piece most operators underweight. If November runs at three times your baseline, a flat average will leave you short through your best month and long through January, so build a monthly index from last year’s pattern and apply it on top of the trend.
Weight recent months more heavily than old ones, since a product’s recent trajectory predicts next month better than a year-old sale does.
You don’t need a forecasting engine to start. You can build a workable forecast from your sales history in Excel and refine the method as your data grows. When you’re ready to go deeper on the approaches — moving averages, seasonal indexes, and when each one fits — the demand forecasting methods guide covers them in full.
Step 3: Set a service level per SKU
A service level is the share of demand you plan to meet from stock. A 95% service level means you’re willing to run out about 5% of the time. It’s a business decision before it’s a math one: a higher service level protects more sales but costs more stock, so you set it by how much a stockout costs you.
Tie the service level to the ABC tier and the margin. Your A-items and high-margin products earn a high service level, because missing their sales is expensive. Your slow, low-margin C-items can run leaner, since the cost of an occasional stockout is smaller than the cost of holding a deep buffer all year.
Step 4: Calculate safety stock
Safety stock is the buffer you hold to absorb the swings a forecast can’t predict — a demand spike, or a shipment that lands late. It’s what turns a service-level target into a number of units. The more your demand and lead time vary, the more buffer the same service level needs.
Two inputs drive it: how much daily demand bounces around, and how much your supplier lead time bounces around. A steady seller from a reliable supplier needs a thin buffer; an erratic seller from a shaky supplier needs a fat one. The full safety stock method walks through both formulas and the service-level math behind them.
Step 5: Set reorder points and order quantities
The reorder point is the stock level that triggers your next order. It’s the demand you expect during the wait for new stock, plus your safety stock: reorder point = (average daily sales × lead time in days) + safety stock. Hit that level and it’s time to place the PO, so fresh stock lands before the buffer runs out.
Two numbers feed it, and both deserve care. The reorder point itself gets its own walkthrough, and your supplier lead time is a measurement worth getting right, since a late shipment is the exact risk the buffer exists to cover.
Then there’s how much to order: order quantity balances the discount and shipping efficiency of a big order against the cash and storage it ties up, and your supplier’s minimum order quantity often sets the floor.
Here’s one A-item run through the numbers
Say it sells 12 units a day, your supplier’s average lead time is 23 days, and you’ve sized safety stock at 60 units to cover the swings. Your reorder point is (12 × 23) + 60 = 336 units.
When on-hand stock drops to 336, you place the PO, and the new shipment lands right about when the buffer would otherwise start to bite. Do this for every A-item and reordering stops being a guess.
Step 6: Review and adjust on a cycle
A plan set once drifts out of date fast. Every cycle — monthly for fast movers, quarterly for the rest — compare what you forecast against what you sold, and feed the gap back into the next forecast. Tracking your forecast error over time tells you whether your estimates are improving or leaning in one direction.
The review is also where you catch stock that’s stopped moving. Flag aging inventory before it becomes dead stock, and decide whether to discount it, bundle it, or stop reordering it.
Which metrics tell you the plan is working?
A few inventory metrics show whether your plan is healthy: inventory turnover tells you how many times you sell through your stock in a year, days inventory on hand converts that into how many days of stock you’re holding, and GMROI ties the margin you earn to the inventory dollars you tie up.
Read them together. Inventory turnover is your cost of goods sold divided by average inventory, and it shows how fast cash cycles through your shelves — many ecommerce brands land somewhere between 4x and 8x a year, though the right number swings with your category and margins. Its sibling days inventory on hand converts that same ratio into days of stock.
GMROI answers a sharper question — for every dollar tied up in stock, how much gross margin does it return — which stops you from celebrating fast turnover on products that barely make money. Watch these by ABC tier and your Step 6 review gains teeth.
Common inventory planning mistakes
Most planning failures trace back to a handful of habits. Watch for these:
- Planning by gut: Reordering on a feeling works until a seasonal spike or a slow month catches you out. Even a rough forecast from your sales history beats intuition.
- One service level for every SKU: Holding the whole catalog to the same target overspends on slow items and underprotects your best sellers. Set the level by tier and margin.
- Ignoring lead-time variability: Planning on an average lead time while a supplier swings from 15 to 35 days guarantees the occasional stockout. Size the buffer for the swing.
- Never revisiting the forecast: A forecast you set in January and forget is wrong by spring. Feed actual sales back in every cycle.
- Timing restocks by hand: Eyeballing when to reorder across dozens of SKUs is where things slip. A reorder point turns the decision into a trigger, so you can time your restocks the same way every cycle.
How to run the whole cycle in one place
Running six steps across a pile of spreadsheets is where good intentions die. The forecast lives in one tab, the safety stock math in another, and the reorder dates in your head — so the plan is only as current as the last time you rebuilt it by hand.
A model with the structure already in place keeps the cycle in one sheet. The Inventory Forecasting template projects twelve months of demand per SKU from your trailing history and a seasonality index, assigns each product an ABC tier and a service level, then calculates the safety stock, reorder point, expected stockout date, and recommended PO date and quantity.
It runs the same in Excel and Google Sheets. Update your sales numbers, and the whole plan re-rates.
Frequently asked questions
What's the difference between inventory planning and inventory management?
Inventory planning decides what to order, how much, and when, while inventory management handles the stock you already own — receiving, storing, counting, and picking it. Planning is the forward-looking decision layer; management is the day-to-day execution. Most small teams do both, but they’re different jobs, and confusing them is how a tidy warehouse still runs out of its best seller.
How often should I redo my inventory plan?
Review your plan on a regular cycle — monthly for fast-moving A-items and quarterly for slower B and C items — rather than only when something breaks. Each review, compare forecast to actual sales, update the forecast, and re-check your reorder points against current lead times. The forecast and buffers age as your sales and suppliers change, so a plan that isn’t revisited quietly stops matching reality.
What's the best inventory planning method for a small store?
The best method for a small store is the simplest one you’ll run every cycle without fail: classify your SKUs with ABC analysis, forecast from your trailing sales, and set a reorder point and safety stock for your A-items first. You don’t need enterprise software to start — a single spreadsheet that holds the forecast, buffer, and reorder date for each SKU serves most stores well past their first seven figures. Add sophistication only where a product’s volume or margin earns it.
