
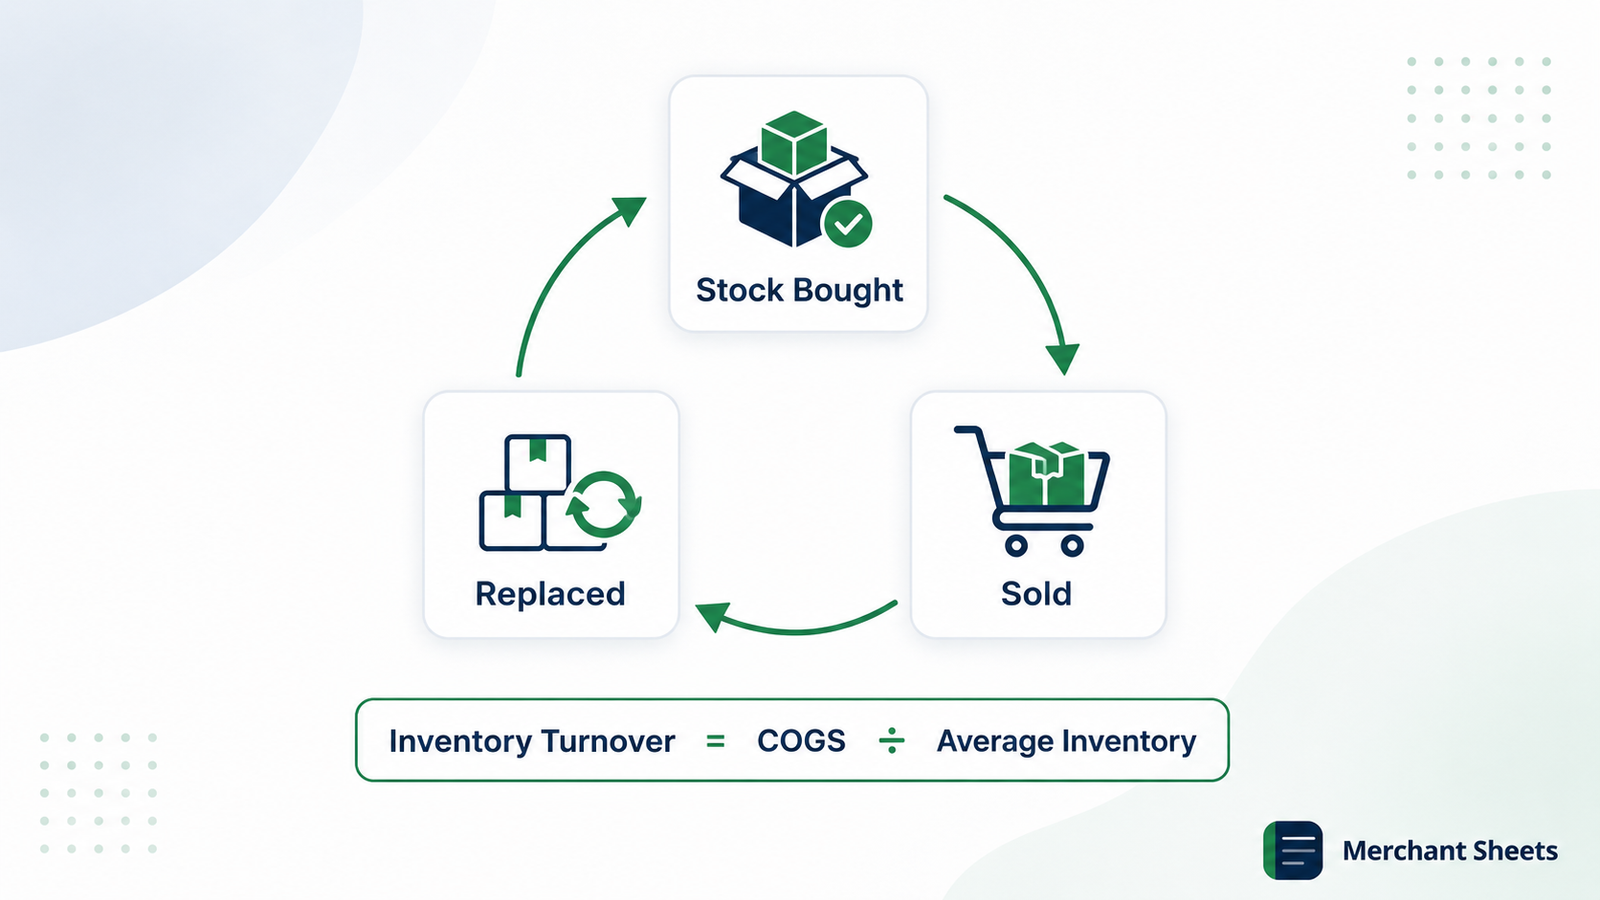
Your inventory turnover ratio counts how many times you sell through your average stock in a period. It’s the quickest read on whether cash is moving or sitting on the shelf, and it sits underneath nearly every other inventory decision, from how much to reorder to which SKUs to cut.
This guide covers the formula and why it uses cost of goods sold rather than sales, a worked example you can rebuild on your own numbers, what counts as a healthy ratio in your category, and the levers that raise a slow one without tipping you into stockouts.
What is the inventory turnover ratio?
The inventory turnover ratio is the number of times a business sells and replaces its average inventory over a period, usually a year. A ratio of 6 means you sold through your average stock six times across the year. A high ratio says stock moves quickly and little cash sits idle; a low ratio says goods are lingering and capital is tied up in them.
It’s one of three inventory metrics people often blur together. Turnover measures speed. Days inventory on hand takes that same speed and states it in days. GMROI weights the speed by how much margin each turn earns.
Read together they tell you how fast stock moves, how long it sits, and whether that movement is profitable, and turnover is the one that starts the conversation.
Why does inventory turnover matter?
Turnover matters because it converts an abstract pile of stock into a cash-flow signal. Every turn is inventory sold and money freed to buy the next round, so a faster ratio means your working capital recycles more often and funds more sales from the same dollars.
A slow ratio does the reverse: it strands cash in goods and runs up holding costs while they wait.
It’s also a leading indicator. Turnover tends to move before your P&L does, flagging a demand shift, an overbuy, or an aging line while you still have time to reprice or reorder.
And because it’s a single comparable number, it’s the cleanest way to measure this quarter against last, one SKU against another, or your catalog against your category.
The inventory turnover formula
The formula divides what your sold stock cost by the average stock you held to sell it:
Inventory turnover = COGS ÷ Average inventory
Cost of goods sold (COGS) is the direct cost of the products you sold in the period: what you paid for them, not what you charged customers. Average inventory is the value of the stock you carried, at cost, found by adding your beginning and ending inventory and dividing by two.
Value both sides at cost. Average inventory is a cost figure, so the numerator has to match it: use COGS rather than sales, since sales carry your margin and would inflate the ratio. Keeping the top and bottom of the formula on the same cost basis is what makes the number comparable to your own history and to industry benchmarks.
A worked example
Say your COGS for the year was $500,000. You started January holding $110,000 of inventory at cost and ended December with $90,000, so your average inventory was $100,000. Divide $500,000 by $100,000 and you turn your inventory 5.0 times a year. Every dollar of average stock moved five dollars of goods, at cost, over the twelve months.
Turning turns into days
Turns are easy to compare across SKUs; days are easier to feel. Divide 365 by the ratio to convert: at 5.0 turns, 365 ÷ 5 = 73 days, so your average unit sits about two and a half months before it sells.
That figure is days inventory on hand, the same efficiency read from the stockroom’s point of view rather than the income statement’s, and it’s worth a closer look when you’re planning around how long stock lasts.
Turnover for shorter periods
You can run turnover for a month or a quarter, not only a year. Use the COGS and average inventory for that window, then annualize when you want to line it up against a yearly benchmark: multiply a monthly ratio by 12 or a quarterly one by 4.
Shorter windows react faster to a demand shift, which is why fast-moving catalogs often watch turnover monthly rather than waiting on the annual figure.
Turnover vs. sell-through rate
Turnover and sell-through rate both measure how fast stock moves, and people swap the terms freely, but they’re built differently. Sell-through is units sold divided by units received over a window, shown as a percentage, and it fits a single buy or a season: sell 700 of a 1,000-unit order in a month and you’re at 70% sell-through.
Turnover works in cost dollars across your whole average inventory and annualizes cleanly, which makes it the better number for benchmarking and for feeding GMROI. Reach for sell-through on a launch or a seasonal drop, and for turnover on the ongoing catalog.
What’s a good inventory turnover ratio?
A good inventory turnover ratio depends on your category, but most ecommerce catalogs run healthy in the 4 to 8 range, with perishable and consumable goods much higher and high-value durables lower.
The number only means something against the economics of what you sell: a 4 that’s strong for furniture would be alarming for fresh food.
The table below shows typical annual turns by ecommerce vertical as of early 2026. Treat them as a starting reference and confirm against your own figures, since the range within any category is wide.
Typical annual inventory turns by ecommerce vertical (as of early 2026).
| Vertical | Typical annual turns | Note |
| Food & beverage | ~12 – 15 | Perishable, fast rotation |
| Supplements | ~8 – 12 | Consumable, repeat purchase |
| Pet | ~8 – 10 | Consumable staples |
| Beauty & personal care | ~4 – 9 | Fast movers alongside slower SKUs |
| Fashion & apparel | ~4 – 7 | Seasonal; higher for fast fashion |
| Electronics | ~4 – 6 | Moderate, with obsolescence risk |
| Home & furniture | ~3 – 5 | High-value, slower rotation |
Two comparisons matter more than the benchmark itself: your ratio against your own vertical, and your ratio against your own trend. A turnover of 5 can be fine in absolute terms and still be a warning sign if you ran 7 last year, so watch the direction as closely as the level.
What does a low inventory turnover ratio tell you?
A low ratio means stock is selling slowly relative to how much you’re holding. The usual causes are overstocking, softer demand than you forecast, pricing that’s drifted above the market, or an assortment that’s gone stale. Whatever the cause, the effect is the same: cash locked up in goods that aren’t moving.
That idle stock costs more than the cash it ties up. It runs up holding costs, from storage and insurance to the capital you can’t spend elsewhere, and the longer it sits, the closer it drifts toward dead stock you’ll have to discount or write off.
A falling turnover ratio is often the earliest number that warns you inventory is aging, well before it shows up as a markdown.
When is a high turnover ratio too high?
A high turnover ratio usually signals healthy demand and lean operations: you’re selling through stock quickly, holding little idle cash, and carrying less risk of obsolescence. For most catalogs, rising turns are a good sign and a fair target.
Past a point, though, high turns shade from efficiency into fragility. If you’re turning so fast that you routinely run out between reorders, you’re trading held cash for lost sales, disappointed customers, and rushed purchase orders at worse terms.
The answer isn’t to slow down; it’s to hold enough safety stock to cover demand and lead-time swings, so you can keep turns high and stay in stock. Aim for turns matched to demand rather than the biggest number you can post.
Higher isn’t automatically better. Beyond the point your buffer can cover, more turns just means more stockouts. You want turns matched to demand, not maxed out.
How do you improve inventory turnover?
Raising a slow ratio comes down to selling what you hold faster or holding less of what sells slowly, both of which follow from tighter inventory planning. Pull these levers, and keep an eye on margin while you do, since discounting your way to more turns can cost more than it earns:
- Forecast demand more accurately: Order to a real forecast rather than gut feel, so you buy closer to what you’ll sell. Better forecasting is the highest-leverage fix for a low ratio.
- Right-size reorder quantities: Order in smaller, more frequent lots so less cash sits in stock between sales. It trades a little shipping efficiency for faster turns.
- Clear slow movers early: Discount, bundle, or promote stagnant SKUs before they age, freeing shelf space and cash for products that move.
- Prune the assortment: Cut chronically slow SKUs so your average inventory reflects what sells. A leaner catalog turns faster on its own.
- Tighten supplier lead times: Shorter lead times let you reorder later and hold a smaller buffer, lifting turns without raising stockout risk.
How do you read turnover beyond one number?
A company-wide turnover ratio is a fine headline and a poor diagnosis. The number that tells you what to do lives underneath it, in three deeper reads.
The first is the trend. One ratio is a dot; a run of them is a direction. Turns sliding from 7 to 5 over three quarters says something a single 5 never could, usually that inventory is growing faster than sales.
The second is the SKU or category view. A catalog turning 5.0 overall can hide a hero SKU turning 12 and a dog turning 1.5, and the average describes neither. Sorting turnover by SKU is what turns the metric into a reorder-and-cut list.
How a blended 5.0 turnover can hide very different SKUs.
| SKU | Annual turns | What to do |
| Hero serum | 12.0 | Reorder aggressively; protect availability |
| Core line | 5.0 | Healthy and steady; hold the line |
| Slow SKU | 1.5 | Cash trap; discount, bundle, or cut |
The third is the 80/20 pattern. In most catalogs a small share of SKUs drives most of the movement, so grouping stock into A, B, and C tiers by turnover and revenue shows where to spend planning attention and where a simple rule will do.
Your fast A-items earn tight forecasting; your slow C-items rarely do.
Turnover, GMROI, and days on hand: how they fit
These three metrics answer neighboring questions, so it helps to keep them straight. Inventory turnover measures how many times you sell through average stock. Days inventory on hand restates that as the number of days stock sits, so it’s turnover read in days.
GMROI takes the same COGS-based turns and weights them by margin, showing the gross profit each inventory dollar earns.
Reach for turnover when you’re gauging efficiency and cash speed, days on hand when you’re planning around how long stock lasts, and GMROI when you’re deciding whether fast-moving stock is also profitable.
That last one matters: GMROI equals your margin-on-cost times your turns, so a SKU can spin quickly and still earn little if its margin is thin.
Turnover is the first read on inventory health, and GMROI and days on hand fill in the rest. Tracked alongside your other ecommerce KPIs, it’s where the analysis starts.
Track turnover across your catalog
A single company-wide turnover ratio hides as much as it shows; the SKUs dragging the average down are the ones you need to see. Surfacing them means tracking cost and sell-through per SKU, which becomes a monthly chore fast.
The Inventory Management Base holds cost and 90-day velocity for each SKU, computes days of cover and an ABC tier, and flags the slow movers tying up the most cash, in Excel or Google Sheets.
Enter your stock position once and let the sheet show you which products are turning and which are stuck.
Frequently asked questions
What is a good inventory turnover ratio?
A good inventory turnover ratio is generally 4 to 8 for most ecommerce catalogs, though it swings hard by category, with perishable food running 14 to 20 and furniture healthy at 3 to 5. Compare against your own vertical and your own trend rather than a single number, since the right target depends on what you sell and how long it keeps.
Should you use COGS or sales to calculate inventory turnover?
Use COGS, because average inventory is valued at cost and dividing sales by a cost figure inflates the ratio by your margin. A sales-based version exists for quick retail-value comparisons, but the standard, apples-to-apples formula divides cost of goods sold by average inventory at cost.
What does a low inventory turnover ratio mean?
A low inventory turnover ratio means stock is selling slowly relative to how much you hold, usually from overstocking, soft demand, or a stale assortment. The cost is cash tied up on the shelf and a rising risk that slow stock ages into dead stock you have to discount or write off.
Can inventory turnover be too high?
Yes, a very high turnover ratio can mean you’re holding too little stock, which leads to stockouts, lost sales, and rushed reorders at worse prices. The goal is turns matched to demand with enough buffer to cover variability, not the highest number you can reach.
What's the difference between inventory turnover and days inventory on hand?
Inventory turnover counts how many times you sell through average stock in a period, while days inventory on hand converts that into the average number of days stock sits before selling. They’re the same speed expressed two ways, since days inventory on hand equals 365 divided by turnover, so 6 turns works out to about 61 days.
