
Key takeaways
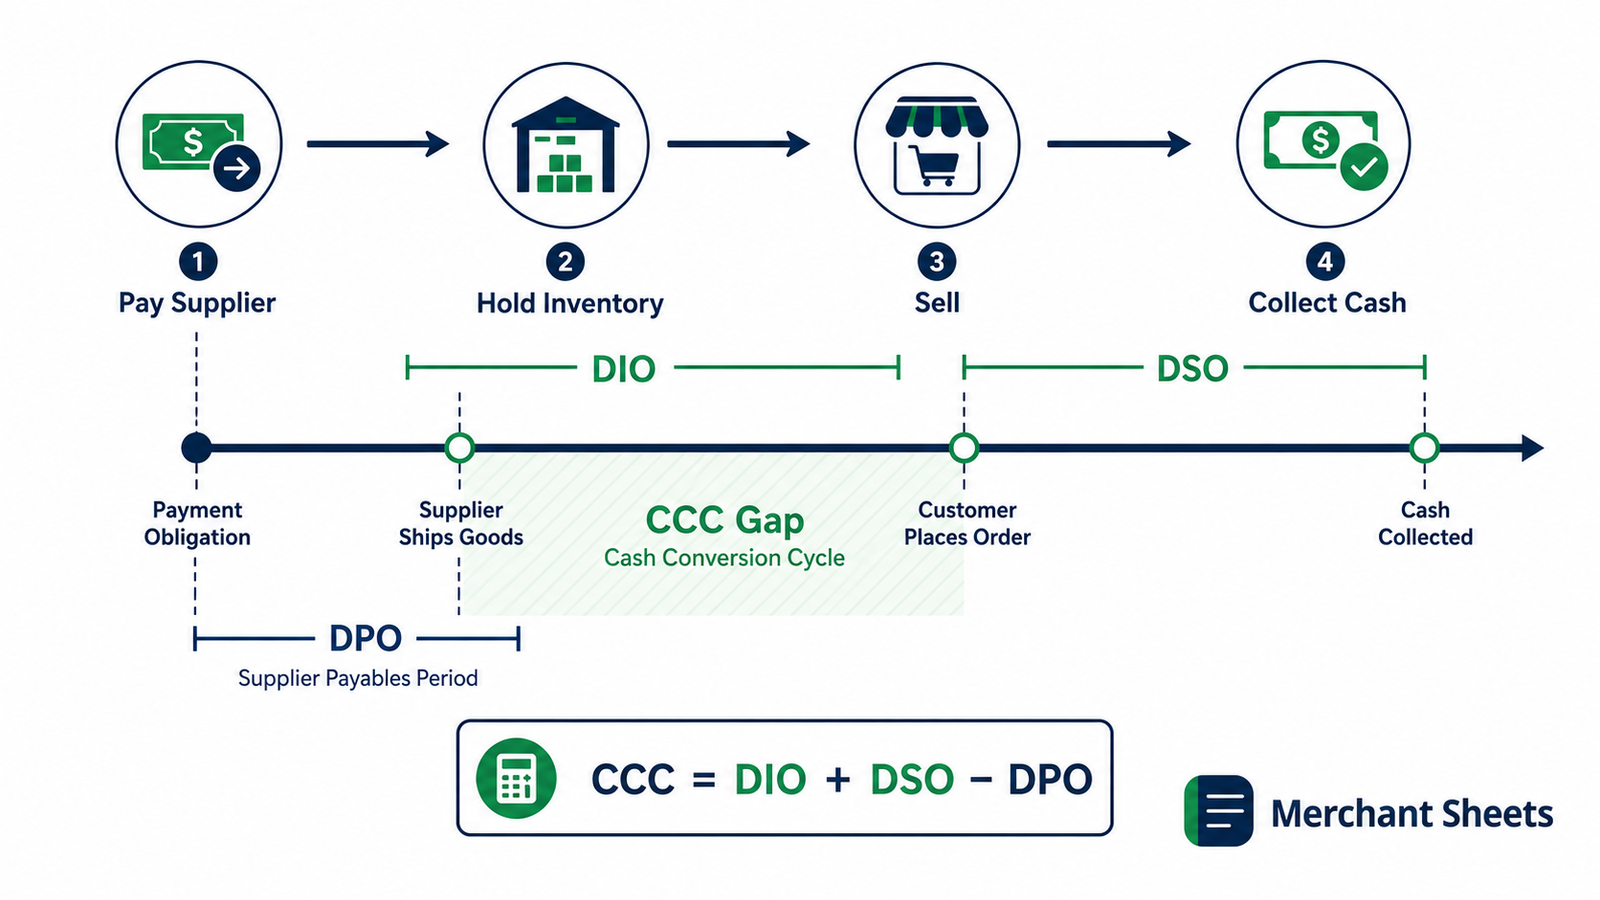
- The cash conversion cycle (CCC) is the number of days your cash is tied up between paying suppliers and collecting from customers. The formula is CCC = DIO + DSO − DPO.
- For an own-brand DTC seller, days sales outstanding is near zero because cards settle in a few days, so the cycle is really inventory days minus supplier-payment days.
- Typical own-brand DTC brands run a 60–120 day cycle. Under 60 days is strong; over 120 usually means too much inventory or paying suppliers too fast.
- Your cycle is a financing bill: working capital tied up equals annual COGS × CCC ÷ 365, roughly $164K for every $1M of COGS at 60 days.
- Inventory (DIO) is the biggest number and the dominant driver; supplier terms (DPO) are the lever you control week to week.
You can post strong margins, grow every quarter, and still watch your bank balance run dry. The reason is almost always the cash conversion cycle — the stretch of days your money sits in inventory and receivables before a supplier payment finally frees it up.
It’s the metric that bridges your profit-and-loss statement and your actual cash, and for a growing ecommerce brand it decides how much of that growth you can fund yourself.
This guide covers the cash conversion cycle formula, a direct-to-consumer (DTC) worked example you can follow in your head, the benchmarks that fit an ecommerce brand, and the two levers that shorten the cycle.
What is the cash conversion cycle?
The cash conversion cycle is the number of days between paying a supplier for inventory and collecting cash from the customer who buys it.
The shorter the cycle, the less working capital — the cash locked in the day-to-day operating of the business — you need to fund the same level of sales. It’s sometimes called the cash-to-cash cycle, and the two names describe the same thing.
For most consumer brands the cycle runs longer than the founder expects. You pay for stock weeks before it ships, hold it in a warehouse, sell it across Shopify and Amazon, then wait on payouts. Every step pushes cash out of reach.
That’s why the CCC is the single best proxy for how much growth you can self-fund: it’s the gap you have to finance out of your own pocket, a line of credit, or an investor’s check.
The cash conversion cycle formula
The formula is one line, built from three day-based components.
| Cash conversion cycle = DIO + DSO − DPO (the days your own cash is tied up) |
Each component measures one leg of the cash-to-cash journey:
| Component | What it measures | How to calculate it |
| Days inventory outstanding (DIO) | How long stock sits before it sells | Inventory ÷ (COGS ÷ 365) |
| Days sales outstanding (DSO) | How long you wait to collect after a sale | Accounts receivable ÷ (Revenue ÷ 365) |
| Days payable outstanding (DPO) | How long you take to pay suppliers | Accounts payable ÷ (COGS ÷ 365) |
Add the days your money sits in inventory (DIO) to the days it sits with customers as receivables (DSO), then subtract the days your suppliers let you wait before paying (DPO). Anything that lengthens the first two stretches the cycle; anything that extends the third shortens it.
The first two on their own — DIO + DSO — are the operating cycle, the time from buying inventory to collecting cash. The CCC takes that and gives you credit for the time you get to hold onto supplier payments.
The components are where the fix lives. A 90-day cycle built from 80 days of inventory and 10 of receivables is a supply-chain problem; the same 90 days built from 30 of inventory and 60 of receivables is a collections problem.
Two of these components trace straight back to inventory metrics you may already track: DIO is the day-count version of inventory turnover, where DIO equals 365 divided by your turns, and it’s the same idea as days inventory on hand.
A worked ecommerce example
Take a consumer brand doing $5M in annual revenue, split roughly 70/30 between Shopify and Amazon, with $2M in COGS. Pull the average balances off the last twelve months:
| Input | Amount | Calculation | Result |
| Average inventory | $410,000 | DIO = 410,000 ÷ (2,000,000 ÷ 365) | 75 days |
| Average accounts receivable | $115,000 | DSO = 115,000 ÷ (5,000,000 ÷ 365) | 8 days |
| Average accounts payable | $165,000 | DPO = 165,000 ÷ (2,000,000 ÷ 365) | 30 days |
| Cash conversion cycle | 75 + 8 − 30 | 53 days |
This brand’s cash is locked up for an average of 53 days per cycle. To grow 50% next year, it has to fund a bigger version of that same 53-day gap, which is the moment most owners start hunting for working capital. To run the number on your own business:
- Pull five figures: Average inventory, average accounts receivable, average accounts payable, COGS, and revenue from your last twelve months.
- Calculate DIO: Inventory divided by daily COGS (COGS ÷ 365).
- Calculate DSO and DPO: Receivables divided by daily revenue, and payables divided by daily COGS.
- Combine them: Add DIO and DSO, subtract DPO. That’s your cash conversion cycle in days.
Why DSO is near zero for DTC (and when it isn’t)
Here’s the piece a general finance guide skips. For an own-brand brand selling through Shopify, your card processor settles in two to four days, so customers effectively pay you at checkout. Your days sales outstanding barely registers, and the whole formula collapses to inventory days minus supplier-payment days.
The entire cash story, for a pure DTC seller, is the gap between how long stock sits and how long you get to wait before paying for it.
That changes the moment your channel mix does. Add Amazon and its roughly 14-day payout cycle starts pushing receivables up. Add wholesale on Net 30 or Net 60 terms and DSO climbs fast, because now you’re waiting a month or more to collect on a big share of revenue.
The margins on wholesale can look better than DTC, but the payment timeline can eat the advantage if you aren’t watching it. Knowing which channels stretch your DSO tells you where the cash pressure is coming from before it lands in your bank balance.
What’s a good cash conversion cycle for ecommerce?
Shorter is always better, because a tighter cycle means less cash tied up to run the same sales. The right benchmark depends on your channel and how many products you carry. Treat these as directional 2026 ranges rather than hard rules:
| Business model / channel | Typical CCC | Notes |
| Shopify-only SMB DTC | 10 – 25 days | Narrow SKU count, card payouts, tight inventory |
| Amazon FBA seller | 25 – 55 days | Marketplace payout cycles and prep costs |
| Multichannel / wholesale | 45 – 75 days | Wholesale receivables stretch DSO |
| Public / broad-catalog DTC | 75 – 120+ days | Wide catalogs strand inventory; DIO runs high |
| Negative CCC (Amazon, Costco) | −30 to −5 days | Collect from customers before paying suppliers |
For most own-brand DTC operations, 60 to 120 days is the common range, under 60 is strong, and over 120 says cash is stuck too long.
Inventory is what drives the spread between one brand and the next: days inventory outstanding does most of the work, because receivables sit near zero and supplier terms move within a narrower band. Watch the trend as closely as the level.
A stable 80-day cycle is healthier than a 70-day cycle drifting toward 100, because the drift is working capital quietly leaving the business even as revenue grows.
What your CCC costs you — and how to shorten it
Your cash conversion cycle is a bill, and its size is set by one line of math: annual COGS multiplied by the cycle, divided by 365. That’s the working capital locked inside your operating cycle at any moment.
| Working capital tied up = annual COGS × CCC ÷ 365. At a 60-day cycle, that’s about $164K for every $1M of COGS. |
Push the cycle from 60 days to 120 and the number doubles. The extra cash has to come from an equity round you didn’t want, a line of credit at today’s rates, or growth you slow down to stay solvent.
That’s why the cycle is a financing decision more than an accounting ratio, and freeing the cash trapped in it is often the cheapest capital you’ll ever touch, because it’s already yours. Two levers move the number:
- Cut your inventory days: Tighten demand planning so you order closer to real sell-through, shift to smaller and more frequent purchase orders, and clear slow-moving SKUs that turn twice a year. Inventory is the biggest of the three components, so this is where the largest gains sit.
- Extend your supplier terms: Moving from net-30 to net-60 adds 30 days of DPO, which subtracts 30 days from your cycle and frees roughly $82K for every $1M of annual COGS. Trade something for it — a volume commitment, a slightly higher unit price, or milestone payments with the balance due net-60 after delivery.
See what your cycle really costs
A cash conversion cycle isn’t a one-time number — it moves every time inventory, sales, or supplier terms shift.
The Ecom Business Model carries DIO, DSO, and DPO through a full three-statement projection, so you can see the cash your cycle locks up month by month and what a change in supplier terms would free before you commit to it. See where your cash is really going.
Frequently asked questions
What is a good cash conversion cycle for an ecommerce brand?
For a narrow-SKU Shopify brand, aim for under 60 days, and the tightest operators run 15 to 25. Broad-catalog and wholesale brands run higher. Under 90 days is healthy for most DTC; over 120 usually means you’re carrying too much inventory or paying suppliers too quickly.
How do I calculate my cash conversion cycle?
Use CCC = DIO + DSO − DPO. DIO is inventory divided by daily COGS, DSO is accounts receivable divided by daily revenue, and DPO is accounts payable divided by daily COGS. Pull those four figures off your balance sheet and P&L and you have the cycle in about ten minutes.
Is a negative cash conversion cycle possible for a DTC brand?
It’s rare but real. You need low inventory days plus supplier terms longer than your inventory holding period, so customer cash lands before supplier payments are due. Amazon, Apple, and Costco run negative cycles on scale and buying power. Most growing brands won’t get there, and that’s fine — the realistic goal is a cycle short enough that growth doesn’t outrun your cash.
What's the difference between the operating cycle and the cash conversion cycle?
The operating cycle is DIO + DSO, the time from buying inventory to collecting from customers. The cash conversion cycle subtracts DPO to credit the time your suppliers wait to be paid. If your operating cycle is 100 days and your DPO is 30, your CCC is 70 — you finance 70 days yourself and your suppliers cover the other 30.
Is a higher or lower cash conversion cycle better?
Lower is better. A shorter cycle means cash spends less time stuck in inventory and receivables, which lowers how much working capital you need and frees cash for growth. A negative cycle, where suppliers effectively finance your inventory, is best-in-class.
