
Key takeaways
- ABC inventory analysis sorts your SKUs into three classes by how much each one matters, so a small group of high-impact items gets most of your attention and the long tail gets the least.
- It’s the 80/20 rule applied to inventory: roughly the top 10% to 20% of SKUs usually drive 70% to 80% of the value, and the bottom half often drives about 5%.
- What you rank on decides everything. Ranking by revenue is the common default and the weakest, because a high-revenue product on a thin margin isn’t your most valuable one.
- Use the classes to aim your attention: count A items more often, forecast them closely, and negotiate their terms hardest.
- The right amount to hold of any one product follows from its margin, demand swings, and lead time, more than from its class.
- ABC is a useful first pass for a large catalog, but it’s a way to prioritize; the order quantities come from per-SKU policy.
You’ve got a few hundred SKUs and no realistic way to watch all of them. ABC inventory analysis is how you decide which ones earn your attention: rank your products by how much each one contributes, and a small group almost always drives most of the value.
Here’s how to run the analysis on your own catalog, and where it stops being useful.
What is ABC inventory analysis?
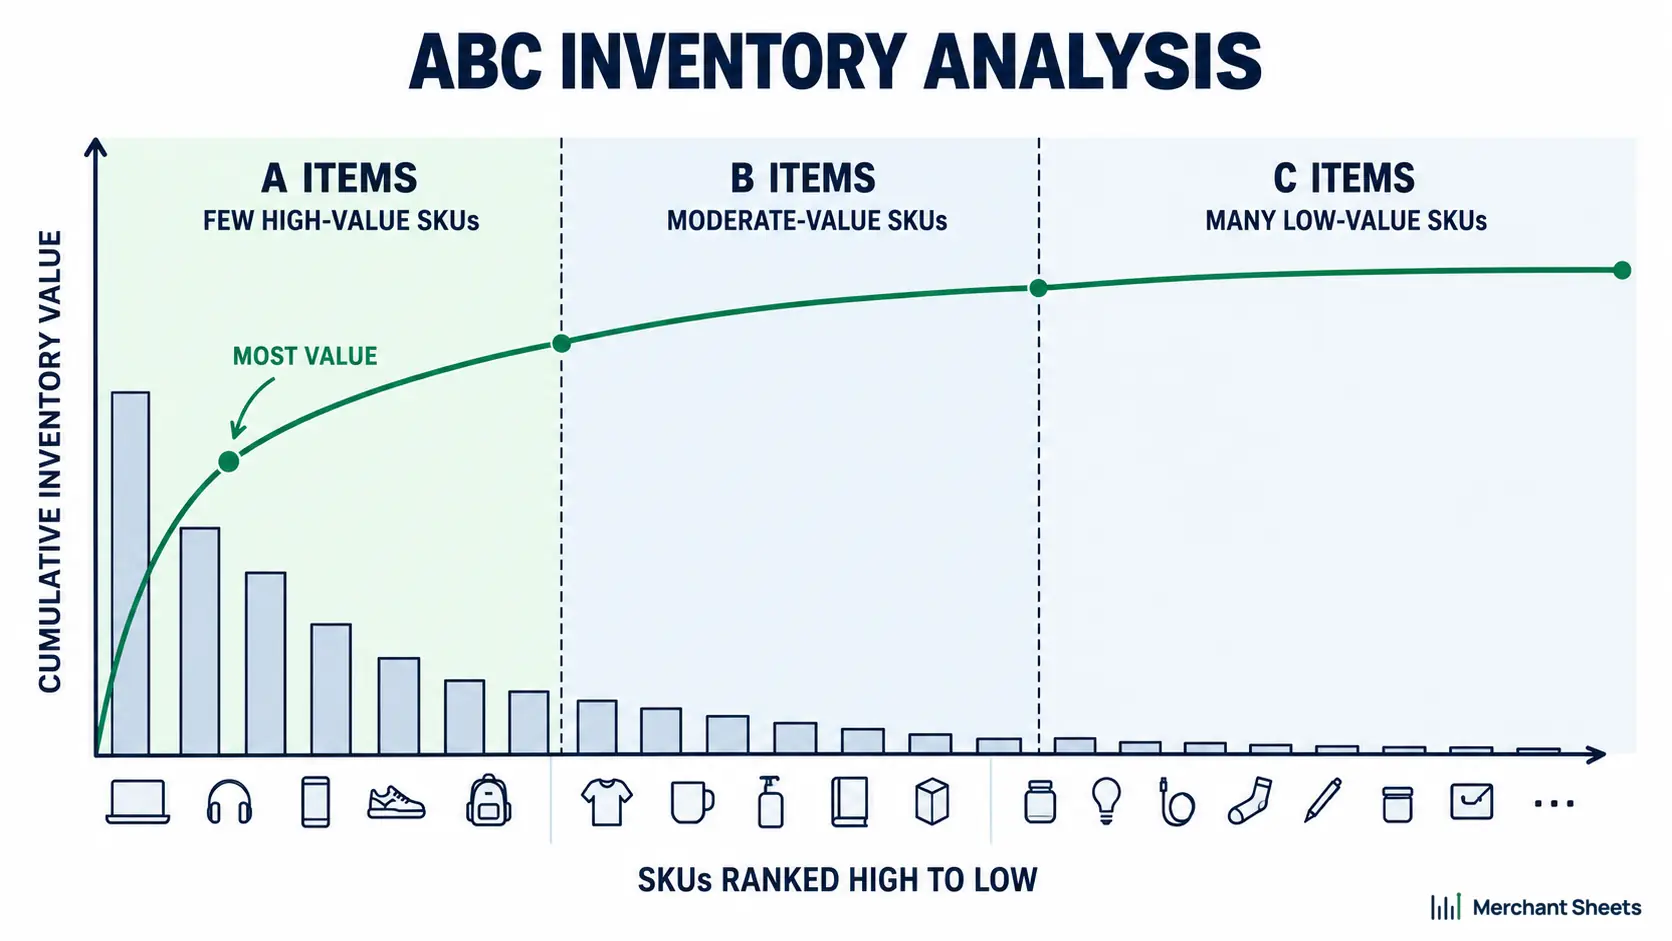
ABC inventory analysis is a way of ranking your SKUs into three classes, A, B, and C, by how much each one contributes to the business, so you can put your attention where it pays off.
A stock-keeping unit (SKU) is one distinct sellable product or variant. The A items are the vital few that drive most of your value, the C items are the large, low-impact tail, and B sits in between.
It’s the Pareto principle, the 80/20 rule that says a small share of causes tends to drive most of the effect, applied to a catalog. The classes aren’t a filing exercise.
They tell you where to spend the things you don’t have enough of: your forecasting time, your counting effort, your negotiating leverage, and your cash.
The 80/20 logic and the three classes
The idea behind ABC analysis is that value in a catalog is lopsided. A few products carry most of it, so you sort your SKUs into three groups and treat each group differently.
Here’s the conventional split, and it’s a starting point rather than a law: A items are roughly the top 10% to 20% of your SKUs and 70% to 80% of the value; B items are the next 30% or so and 15% to 20% of the value; C items are the remaining half and about 5%.
Your own numbers won’t land exactly here, because every catalog’s curve is different, so draw the lines where your cumulative value bends.
Table 1. A typical ABC split (the percentages vary by catalog).
| Class | Typical share of SKUs | Typical share of value |
| A | Top 10%–20% | 70%–80% |
| B | Next ~30% | 15%–20% |
| C | Bottom ~50% | ~5% |
What should you rank on? The criterion is the whole game
Before you rank anything, decide what “matters” means, because the criterion you pick changes which products land in A. Most guides rank by revenue, and that’s the weakest choice. A product can top your sales chart and still keep little of each dollar, while a quieter SKU with a fat margin does more for your profit and cash.
| Rank by profit before revenue. A product can top your sales chart and still keep little of each dollar, so a high-revenue SKU on a thin margin isn’t automatically your most valuable one. |
Rank by profit contribution or by GMROI instead. Ranking on margin dollars puts your real earners at the top rather than your loudest sellers. GMROI weighs the margin each turn earns, which rewards a lower-priced product that moves fast and constantly.
That velocity is the other half of the picture, because how fast it sells through matters as much as what each sale keeps. A useful move is to run two views, one by revenue and one by margin, and watch which SKUs jump between them.
Leave room for judgment on top of the ranking. A handful of products earn A-level care for reasons the numbers won’t show: a hero product that anchors the brand, a subscription mainstay that drives repeat orders, or a component other bundles depend on.
If a stockout there does damage well beyond that SKU’s own margin, treat it as an A regardless of where it ranks. The classification is one input to that call.
Table 2. What each ranking criterion surfaces.
| Criterion | What it surfaces | When to use it |
| Annual revenue | Your biggest sellers by top line | A quick first pass; weakest on its own |
| Profit contribution (margin $) | The products that carry your profit | The default for a profit-focused brand |
| Unit cost / cash tied up | Where your cash is concentrated | When cash, not profit, is the constraint |
| GMROI (margin and turns) | Earners that also move fast | The most complete single view |
How to run an ABC analysis, step by step
You run an ABC analysis by ranking every SKU on your chosen criterion, adding a running total, and drawing the class lines. It’s a spreadsheet job at this scale: a sort and one cumulative-sum column, and an inventory app can auto-classify for you, though you still choose the criterion it uses.
In a spreadsheet, it’s four columns next to your SKU list: annual value (units times unit revenue or unit margin), the same column sorted high to low, a running cumulative total, and that total divided by the grand total to get a cumulative percentage.
A nested IF on that percentage stamps the class, for example, A below 80%, B below 95%, and C above. Pull the raw numbers from your Shopify and Amazon exports, and for Amazon products use the margin left after FBA and referral fees, since those can turn an apparent A into a B.
- Pull 12 months of SKU-level data: units sold and either revenue or margin per unit.
- Calculate each SKU’s annual value on your criterion (annual units times unit value).
- Sort the list from highest annual value to lowest.
- Add a running cumulative percentage of the total value down the list.
- Draw the class lines where the curve bends, for example, A up to about 80% cumulative, B to about 95%, and C the rest.
- Label each SKU A, B, or C, and decide what changes for each class.
A worked example on an ecommerce catalog
Here’s what the ranking looks like on a small catalog. Say you sell 10 products and rank them by annual margin contribution, units times unit margin. Sort them high to low, add the cumulative percentage, and the classes fall out.
The top three products drive about 77% of the margin and land in A. The next three make up B. The bottom four together add a little over 5% and sit in C, which is exactly the group you don’t want absorbing your reorder attention.
Rank the same catalog by revenue, and the order would shift, which is why the criterion you pick in step two matters so much.
Table 3. A worked ABC analysis, ranked by annual margin contribution.
| SKU | Annual units | Unit margin | Annual margin | Cumulative % | Class |
| SKU-01 | 8,000 | $18 | $144,000 | 35.1% | A |
| SKU-02 | 5,000 | $20 | $100,000 | 59.5% | A |
| SKU-03 | 6,000 | $12 | $72,000 | 77.0% | A |
| SKU-04 | 3,000 | $10 | $30,000 | 84.3% | B |
| SKU-05 | 4,000 | $6 | $24,000 | 90.2% | B |
| SKU-06 | 2,000 | $9 | $18,000 | 94.6% | B |
| SKU-07 | 1,500 | $8 | $12,000 | 97.5% | C |
| SKU-08 | 1,000 | $6 | $6,000 | 99.0% | C |
| SKU-09 | 800 | $4 | $3,200 | 99.8% | C |
| SKU-10 | 500 | $2 | $1,000 | 100% | C |
What to do with each class
The classes are only worth building if you treat them differently, and the right difference is how much attention each gets, in review time and scrutiny.
Your A items earn the closest forecast, the tightest reorder discipline, the most frequent counts, and your hardest supplier negotiation, because an error there costs the most. That’s where a review rhythm helps: A items get looked at weekly, B items monthly, and C items only when something trips a reorder or a clean-out.
B items otherwise get standard rules and the occasional check. C items run on simple reorder points and some bundling, plus a regular look for stock that has stopped moving before it becomes dead stock you have to clear.
| Use the classes to aim your attention, not to set your stock levels. What to hold of any one product comes from its own margin, demand, and lead time. |
Table 4. How to treat each class.
| Class | How to treat it |
| A | Forecast closely, reorder on a tight cadence, count most often, negotiate hardest |
| B | Review periodically; standard reorder rules with the occasional check |
| C | Simple reorder points, bundle or discontinue, and watch for dead stock |
Where ABC analysis falls short
ABC is a good way to prioritize attention and a weak way to set stocking policy, and it’s worth knowing which is which before you lean on it. The classes point you at the right products; they don’t tell you how much of each to hold.
The supply-chain data scientist Nicolas Vandeput makes the case bluntly: using ABC, or its ABC-XYZ cousin, to set service levels by bucket leaves money on the table, because the right policy is a per-product calculation rather than a group default.
- One criterion hides a lot: Rank on revenue alone and you’ll lavish attention on high-revenue, thin-margin SKUs while your real earners sit quietly in B.
- The buckets drift: A class list goes stale as demand shifts, so it needs re-running, or you’re managing last quarter’s catalog.
- New and seasonal items get miscategorized: A product with little sales history lands in the wrong class until it builds a track record.
- One policy per bucket is the real trap: The right buffer for each product depends on its margin, demand swings, and lead time, so a single service level across your A items overstocks some and understocks others at once.
- It shows you where to look: The classes flag the important SKUs, and the order quantities come from each one’s own numbers.
ABC-XYZ: adding demand variability
If you want the classification to say something about how predictable a product is, ABC-XYZ adds a second axis. A, B, and C still rank value, while X, Y, and Z rank demand variability: X for steady, Y for variable, and Z for erratic. An AX item is high-value and easy to forecast; an AZ item is high-value and lumpy, and it needs different handling entirely.
It’s a sharper tool than plain ABC, and it carries the same limit, because it’s still buckets. It belongs in the “where to look” column and leaves the “how much to order” question to per-SKU policy.
The variability signal it leans on is at heart a forecasting question, so it pairs best with a real read on how predictable its demand is.
How often should you redo it, and where it fits
Re-run your ABC analysis when your mix changes materially, or on a set cadence, quarterly for a typical catalog and monthly for fast-moving or seasonal ones. The classes drift, and a stale classification quietly sends your attention to last season’s winners.
It helps to be clear about what the analysis is for. ABC is a periodic pass that organizes your catalog and points your effort. How you plan your inventory day to day, and the cash tied up in stock, come from the per-product decisions underneath it.
Treat the classes as a map, and keep the routing, the buy quantities, and the buffers, on each SKU’s own economics.
Frequently asked questions
What is ABC analysis in inventory management?
ABC analysis is a method of ranking SKUs into three classes, A, B, and C, by how much each one contributes to the business, so the highest-impact items get the most attention and the long tail gets the least.
How do you calculate ABC analysis?
Rank each SKU by its annual value on your chosen criterion units times unit revenue or unit margin, add a running cumulative percentage of the total, then draw the class lines, commonly around 80% cumulative for A and 95% for B.
What is the 80/20 rule in inventory?
It’s the Pareto principle applied to a catalog: roughly the top 10% to 20% of SKUs tend to drive 70% to 80% of the value, so a small group of products deserves most of your management attention.
What are A, B, and C items?
A items are the small group of high-impact SKUs that drive most of the value; C items are the large, low-impact tail; and B items are the middle, and the classes set how much attention each group gets.
Should you rank ABC analysis by revenue or profit?
Rank by profit contribution or GMROI rather than revenue alone, because a high-revenue SKU on a thin margin can matter less to your cash and profit than a smaller-revenue SKU that keeps more of every dollar.
What is the difference between ABC and ABC-XYZ analysis?
ABC classifies SKUs by value only, while ABC-XYZ adds a second axis for demand variability: X for steady, Y for variable, and Z for erratic, so it indicates both a SKU’s importance and its predictability.
What are the limitations of ABC analysis?
Its classes are only as good as the single criterion behind them; they drift as demand changes; and, most importantly, a bucket shouldn’t set stocking policy, since the right amount to hold of a SKU depends on its own margin, demand variability, and lead time.
Is ABC analysis worth doing?
For a catalog too large to manage SKU by SKU, it’s a useful first pass for deciding where your attention goes, and for the actual order quantities, per-SKU planning does more than the buckets can.
How often should you update ABC analysis?
Re-run it when your product mix changes materially, or on a regular cadence, quarterly for a typical catalog and monthly for fast-moving or seasonal ones, because the classes go stale as demand shifts.
