
Key takeaways
- Sell-through rate is the share of a product you received that you sold in a period, usually a month: units sold divided by units received, times 100.
- It’s a short-window, per-product read on velocity, which makes it more useful for a single buy than a whole-catalog metric like inventory turnover.
- A healthy rate is roughly 65% to 80% a month for many categories, but the right number varies by category, season, and margin, so treat any benchmark as directional.
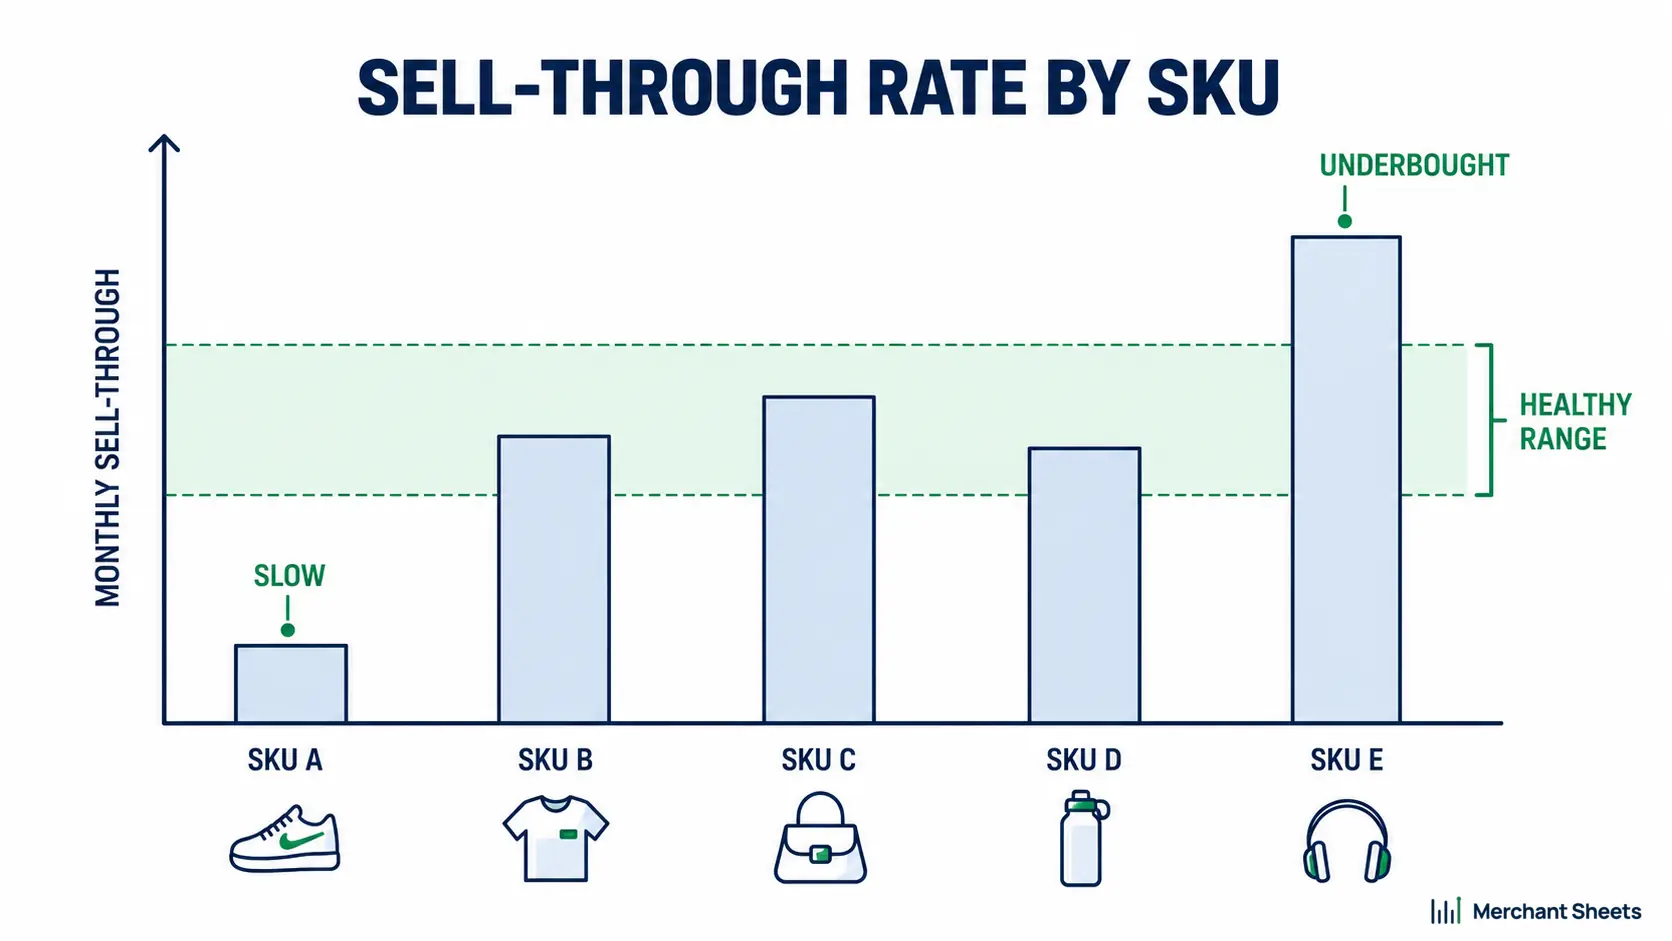
- Higher isn’t automatically better: a rate near 100% usually means you underbought and stocked out, leaving sales on the table.
- Read it per SKU per period, so your fast movers and slow movers don’t hide inside one blended number.
- You improve it mostly by buying better: size orders to real demand, back the winners fast, and clear the slow movers early rather than late.
You bought 500 units, and a month later you want to know how that buy is doing. Sell-through rate is the number that tells you the share of what you received that you’ve sold. It’s how you spot a winner to reorder, a dud to clear, and a product you underbought.
What is sell-through rate?
Sell-through rate is the percentage of the inventory you received that you sold over a set period, usually a month. It measures how fast one product or one buy is moving, so it answers a narrower question than a whole-catalog metric: of the units you brought in, how many went out the door in this window?
What makes it useful is speed. Sell-through gives you a read on a buy within days or weeks, long before slower measures catch up, so it works as both an early warning on a launch that’s dragging and a green light to reorder something that’s flying. It’s the number a buyer checks first.
A sell-through rate means little without that window attached. The same SKU can read 40% over two weeks and 85% over two months, so always say the period out loud: this month, this launch, this season.
Measure it per product too, because a single blended figure across your catalog hides the winners and the laggards you most need to see.
The sell-through rate formula
The formula is short. Sell-through rate is the units you sold divided by the units you received, times 100, over your chosen period. Units received is the quantity of that product you brought into stock for the period, whether that’s a fresh purchase order or the opening inventory you started with.
| Sell-through rate = units sold ÷ units received × 100, measured over a set period. |
Pulling the numbers is quick. Units sold comes straight from your Shopify or Amazon sales report for the period; units received is the quantity on the purchase order, or your opening stock count.
One variant divides by units on hand or units available instead of units received, and either works, so pick one and use it consistently.
Decide too whether you’re measuring sell-through since launch (cumulative) or within a single month, and keep that consistent across SKUs so the numbers compare.
Here’s a month of sales across four SKUs bought in the same drop, to show how differently they read. SKU A and SKU B are healthy, moving most of what came in. SKU C sold less than a third and is a markdown candidate.
SKU D is the one to notice: at 98% it nearly sold out, which looks great until you see that it probably lost sales in the days it sat empty.
The blended rate across all four is about 68%, which tells you almost nothing on its own, and that’s the case for reading the number per SKU.
Table 1. A month of sell-through across four SKUs from the same buy.
| SKU | Units received | Units sold | Sell-through rate | The read |
| SKU A | 500 | 425 | 85% | Healthy |
| SKU B | 300 | 210 | 70% | Healthy |
| SKU C | 400 | 120 | 30% | Slow, a markdown candidate |
| SKU D | 200 | 196 | 98% | Likely underbought, restock |
What’s a good sell-through rate?
For many mid-velocity categories, a healthy monthly sell-through lands somewhere around 65% to 80%. The honest answer is that it depends: on your category, your season, your price, and your margin.
A fast-fashion drop and a high-ticket furniture line are meant to move at different speeds, so the same 50% reads as fine for one and a problem for the other.
Weigh the rate against margin rather than reading it on its own. A high-margin product can sit at a lower sell-through and still pay its way, while a thin-margin item has to move to earn its space.
Season matters just as much: a holiday SKU is supposed to sell out by late December, so a 70% rate in November might mean you’re about to run short. Use the ranges below as a directional guide rather than a target to hit.
The one reading that stays fairly consistent is the low end. A monthly sell-through under about 40% is slow, and it’s an early sign of excess stock, or of stock that’s aging on the shelf, so treat it as a cue to act before it turns into a clearance problem.
Table 2. Rough healthy monthly sell-through ranges by category (directional, and they vary by source).
| Category | Rough healthy monthly range |
| Apparel & fashion | 65%–85% |
| Health & beauty | 75%–90% |
| Sporting goods | 70%–85% |
| Consumer electronics | 60%–75% |
| Home & furniture | 55%–75% |
| Luxury & jewelry | 50%–65% |
Why a higher sell-through isn’t always better
It’s easy to read sell-through as a score where higher wins, and that’s the one trap worth avoiding. A rate near 100% almost always means the product sold out before the period ended, so you underbought and left sales on the table. On Amazon especially, a stockout can cost you rank and momentum that take weeks to rebuild.
Selling your last unit on day 20 of a 30-day month isn’t a win if you could have sold half again as many.
The goal is a healthy rate matched to how fast you can restock: high enough that stock isn’t sitting, and low enough that you’re not constantly running out. Read a rate near 100% as a signal to buy more of that product next time, the same way a low rate is a signal to buy less or clear what you have.
| A near-100% sell-through isn’t the goal. It usually means you underbought and stocked out. Aim for a healthy rate you can restock against, and treat a near-100% number as a signal to buy more next time. |
How to read your sell-through rate
Once you have the number per SKU, the read falls into three bands, and each one points to a different move. A slow rate says you overbought or demand is soft, so the job is to stop the bleed and free the cash. A healthy rate says your buy matched demand, so protect the pattern. A rate that’s too fast says you underbought, so the fix is on the next order, not this one.
Table 3. Reading your sell-through rate and what to do about it.
| Sell-through read | What it likely means | What to do |
| Under ~40% (slow) | Overbought, or demand is softer than planned | Mark down early, pause reorders, and review the buy |
| ~65%–80% (healthy) | Your order matched demand | Hold the pattern and reorder to plan |
| Near 100% (too fast) | Underbought; you likely stocked out | Buy more next time and tighten replenishment |
Sell-through rate vs inventory turnover
Sell-through rate and inventory turnover both measure velocity, and they answer different questions. Sell-through is one product or one buy over a short window, usually a month, against the units you received.
Inventory turnover is your whole inventory over a year, measured against cost of goods sold, and it tells you how many times your whole inventory sells and gets replaced in that time.
They also work on different clocks. Sell-through is a leading indicator you can act on this week, while turnover is a lagging one that confirms how the year went. Use sell-through to judge a specific buy or launch and decide what to reorder or clear; use turnover to judge overall inventory efficiency.
A SKU can post a strong monthly sell-through and still feed a perfectly healthy annual turnover, because the two sit at different altitudes, so it’s worth tracking both.
How to improve your sell-through rate
You raise a low sell-through mostly upstream, in how you plan your inventory, and then by moving what’s already slow. The levers, roughly in order of impact:
- Buy to real demand: Size each order to demand signals and lead time; buying to real demand rather than to last year’s number is the biggest lever you have.
- Back your winners fast: Reorder and feature what’s moving before it stocks out, since your best sellers are where underbuying costs the most.
- Adjust price before you’re stuck: Small, early price and promo changes in the first weeks beat a deep panic markdown at the end.
- Clear slow movers early: Discount in phases, a modest cut and then a deeper one, to move slow stock before it becomes dead stock you write off.
- Merchandise and bundle: Better images, placement, and bundles move slow units without touching price.
- Shorten the feedback loop: Check sell-through weekly rather than at season’s end, so you act on a slow SKU or a sold-out winner while it still matters.
Sell-through rate on Amazon
Amazon has its own sell-through rate, and it affects more than a dashboard number. Amazon’s FBA sell-through is your units sold and shipped over the trailing 90 days divided by the average units available in that time, so it’s the same idea on a rolling window.
What makes it matter is where it feeds: Amazon uses it in your inventory performance, and a low rate can tighten your FBA storage capacity and add aged-inventory fees, so slow sell-through costs you space and money at once.
You’ll find the figure in your inventory performance and restock reports in Seller Central, alongside your storage limits. The fix is the one this whole article points at: send in what you can sell through, restock the movers, and don’t pile excess units into FBA.
Treat the 90-day rate as a running scorecard on how well your Amazon buying matches demand, and check the current definition and capacity rules in Seller Central, since Amazon changes them.
Frequently asked questions
What is sell-through rate?
Sell-through rate is the percentage of the inventory you received that you sold over a set period, usually a month, calculated as units sold divided by units received times 100.
How do you calculate sell-through rate?
Divide the units you sold in the period by the units you received, then multiply by 100; for example, 425 sold out of 500 received is an 85% sell-through rate.
What is a good sell-through rate?
Roughly 65% to 80% a month is healthy for many categories, but the right number depends on your category, season, and margin, so treat benchmarks as directional rather than targets.
Is a higher sell-through rate always better?
No, a rate near 100% usually means you underbought and stocked out, so the goal is a healthy rate you can restock against rather than the highest possible number.
What's the difference between sell-through rate and inventory turnover?
Sell-through rate measures one product or buy over a short window against units received, while inventory turnover measures your whole inventory over a year against cost of goods sold.
What time period should you use for sell-through rate?
Monthly is the usual choice, but you can use a week, a quarter, or the length of a launch or season; the key is to attach a consistent period every time.
How do you improve a low sell-through rate?
Buy closer to real demand, reorder and feature your winners quickly, and clear slow movers with early, phased markdowns rather than one late clearance.
What is Amazon's sell-through rate?
Amazon’s FBA sell-through rate is your units sold and shipped over the past 90 days divided by the average units available in that time, and it factors into your storage capacity, so verify the current definition in Seller Central.
