
Key takeaways
- An inventory KPI is a number that tells you how well your stock is doing its job: selling fast enough, earning enough margin, staying available, and not tying up more cash than it should.
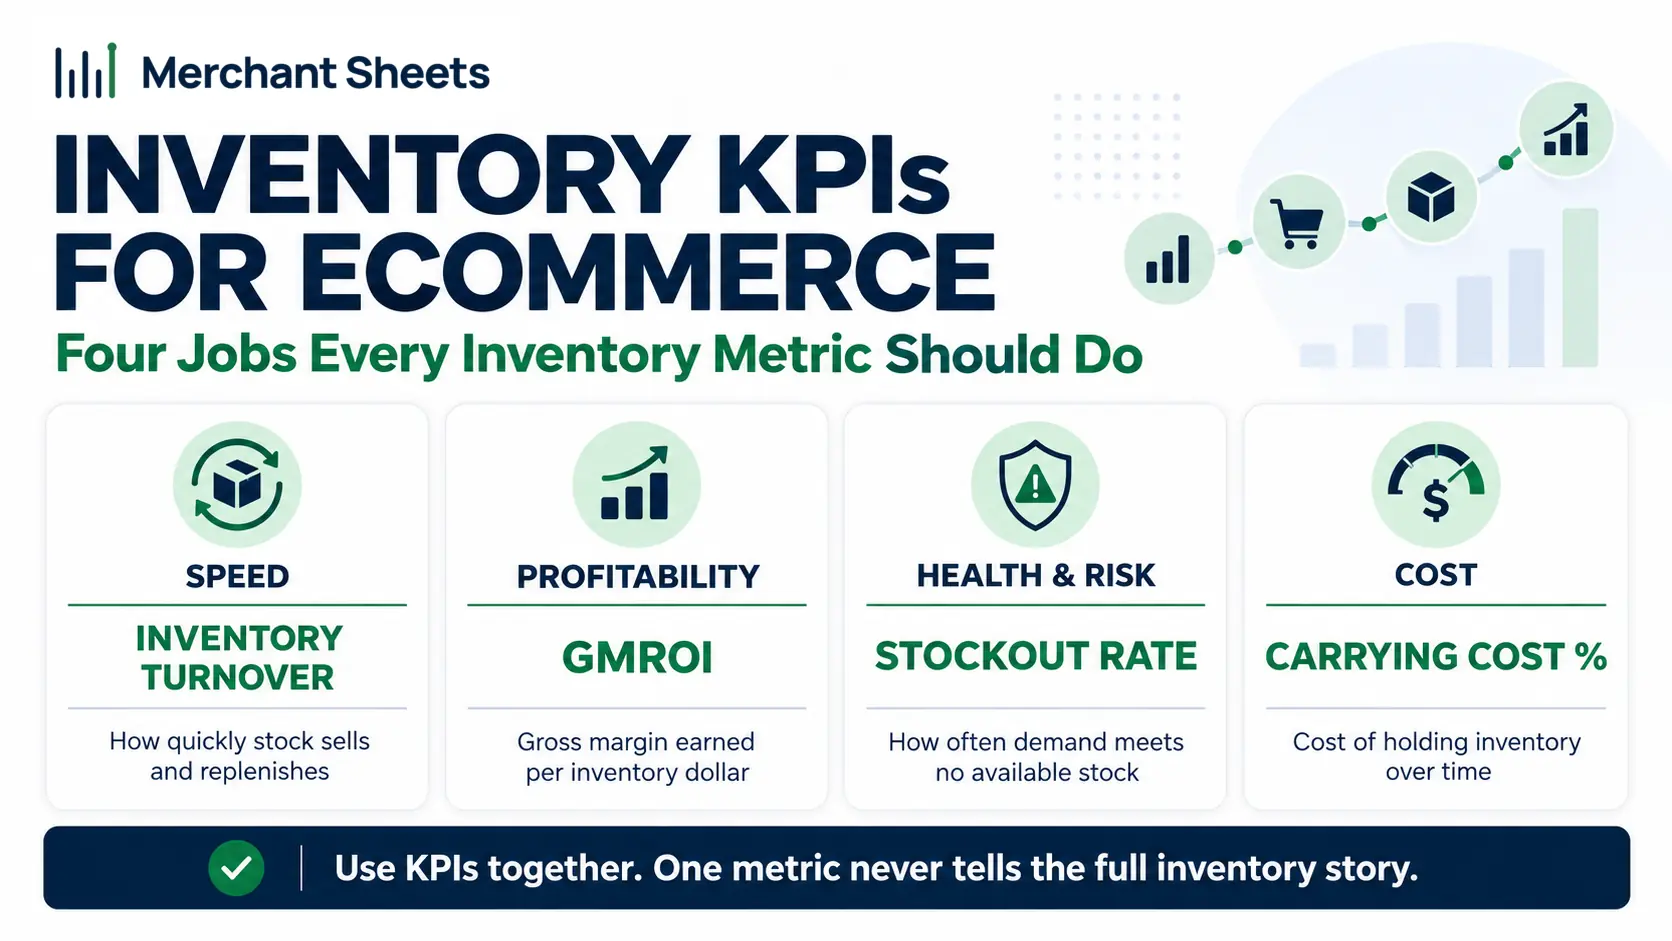
- The core inventory KPIs group into four jobs: speed (inventory turnover, days inventory on hand, weeks of cover), profitability (GMROI, sell-through rate), health and risk (in-stock rate, inventory aging, accuracy and shrinkage), and cost (inventory carrying cost).
- Inventory turnover is COGS divided by average inventory, and days inventory on hand is 365 divided by turnover; together they tell you how fast stock moves.
- GMROI is gross margin dollars divided by average inventory cost, and anything above 1 means your stock earns back more than a dollar of margin per dollar tied up; it’s the one metric that ties margin to turnover.
- Most inventory benchmarks vary by category and shift over time, so compare each number to your own trend rather than a universal target; GMROI’s floor of 1 is the main hard line.
- Don’t track all of them: pick the three to five KPIs that map to a decision you’ll act on, and keep the rest as diagnostics you pull when a headline number moves.
You can measure a dozen things about your inventory, and drowning in metrics is its own way of flying blind. A handful of numbers tell you what matters: whether stock is selling fast enough, earning its margin, staying available, and not eating cash.
What is an inventory KPI?
An inventory KPI (key performance indicator) is a metric that measures how well your inventory is performing against a goal, such as how fast it sells, how much margin it returns, or how much cash it ties up. It turns a shelf full of product into a few numbers you can act on.
For a physical-product brand, inventory is usually the single biggest use of your cash. You pay for stock months before a customer pays you for it, so every inventory KPI is a question about whether that cash is working. Stock that sells fast and earns its margin is cash doing its job; stock that sits is cash frozen on a shelf.
The metrics worth watching cover four jobs: how fast your stock moves, how much profit it earns, how healthy and at-risk it is, and what it costs to hold.
Keep those four in mind, and the long lists of inventory metrics online sort themselves into a short, usable set. Speed and profitability tell you whether that cash is working; health and cost tell you what’s putting it at risk.
These numbers are one panel of the wider set of numbers you watch, and they feed straight into how you plan your inventory, from what to reorder to how much to hold.
A quick note on two terms you’ll see throughout. Inventory turnover is how many times you sell and replace your stock in a period, and GMROI, gross margin return on investment, is how much gross margin each dollar of stock earns back.
The inventory KPIs every ecommerce brand should track
Here’s the core set, grouped by the four jobs. Each row gives the formula, how to read it, and the decision it drives; the sections that follow go a level deeper on each group, and the worked math for any single metric lives on its own page.
| Inventory KPI | Formula | How to read it | Decision it drives |
| Inventory turnover | COGS ÷ average inventory (at cost) | Times you sold and replaced stock in the period; higher is leaner, too high risks stockouts | How lean to run, and whether cash is freeing up |
| Days inventory on hand | 365 ÷ inventory turnover | The same speed in days, how long stock sits before it sells | How long cash stays tied up in stock |
| Weeks of cover | On-hand units ÷ average weekly sales | Your forward runway at the current sell rate | When to reorder, and what to expedite or slow |
| GMROI | Gross margin $ ÷ average inventory cost | Margin earned per $1 of stock; above 1 is the floor | Which products earn their shelf space, and what to cut or reprice |
| Sell-through rate | Units sold ÷ units received × 100 (per period) | Share of a buy you’ve cleared, and how well demand matched the order | Whether to reorder, hold, or mark down |
| In-stock rate | SKUs in stock ÷ total SKUs × 100 | Availability; the inverse is your stockout rate | Where you’re losing sales to being out of stock |
| Inventory aging | Value of stock past a set age ÷ total inventory value | Share of your cash frozen in slow movers | What to promote or mark down before it’s dead |
| Inventory accuracy | Items counted that matched ÷ items counted × 100 | How far records drift from reality; target about 97% to 99% | Whether you can trust any of these numbers |
| Shrinkage rate | (Recorded − actual) ÷ recorded × 100 | Stock lost to error, damage, returns, or theft | How much margin is leaking, and where to tighten |
| Inventory carrying cost | Annual holding cost ÷ average inventory value × 100 | The yearly cost of holding stock, often about 20% to 30% | Whether slow, low-return stock is worth keeping |
Speed: How fast is your stock moving?
Three KPIs tell you how fast inventory moves, which is how fast the cash inside it comes back to you. They look at the same thing from slightly different angles.
Inventory turnover is the headline number: COGS divided by your average inventory at cost, or how many times you sold and replaced your stock in a period. A higher number means you’re running leaner and recycling cash faster, though push it too high, and you start stocking out.
Say you did $800,000 in COGS on $160,000 of average stock: that’s a turnover of 5, or stock replaced about every ten weeks. What counts as good swings hard by category, so watch how fast you sell through stock against your own history rather than a universal target.
Days inventory on hand is the same idea in days: 365 divided by turnover, or how long stock sits before it sells. A turnover of 6 is about 61 days on hand.
Some operators find the days version easier to reason about, because it lines up with lead times and reorder windows in plain calendar terms.
Weeks of cover, sometimes called days of supply, is the forward-looking cousin: on-hand units divided by your average weekly sales, giving the runway you have left at the current sell rate.
Turnover and days on hand look backward at what already happened; weeks of cover looks forward and tells you what to reorder and when. That makes it the one of the three you’ll check most often.
Profitability: Is your stock earning its keep?
Speed alone can fool you. A product can turn quickly and still make almost no money, which is why fast movers sometimes flatter a dashboard while quietly earning little. To catch that, you need a metric that ties margin to turnover.
GMROI does exactly that. It’s your gross margin in dollars divided by the average cost of the inventory that produced it, and it answers a sharp question: for every dollar tied up in this stock, how many dollars of margin did it earn back?
Above 1 means the stock earned more than a dollar of margin per dollar invested, so 1 is the floor for a product that pays its way. Picture two products that each turn five times a year, one at a 55% gross margin and one at 15%: they look identical on a turnover report, but the first posts several times the GMROI, and it’s the one you want more of.
A strong GMROI depends on your category and price point, so use it to rank the margin each dollar of stock earns across your own catalog and against similar products, and let it flag a fast-turning SKU that turns quickly but still earns little.
Sell-through rate comes at profitability from the demand side: units sold divided by units received over a period, as a percentage. It tells you how much of a buy you’ve cleared and whether your order matched real demand.
A low sell-through weeks after a launch is an early warning that the buy was too big or the price is wrong, well before the stock ages into a markdown.
Health and risk: Is your stock available, fresh, and accurate?
The next KPIs are your early-warning panel. They flag three kinds of trouble before each one turns into lost sales or a write-down: the availability problem, the aging problem, and the trust problem.
In-stock rate is the share of your SKUs that are in stock and sellable, and its inverse, the stockout rate, is the share that have run dry. A slipping in-stock rate is revenue walking out the door, because a customer who can’t buy today often buys from someone else, and understanding what a stockout costs you turns that abstract percentage into a dollar figure worth acting on.
Set a target band and watch the trend: a brand that lives at 95% in stock and drifts to 88% is leaking sales it may not notice in the top line until a slow month.
Inventory aging measures how long stock has been sitting: the value of stock past a set age as a share of total inventory value. The oldest slice is your dead stock risk, and the discipline of clearing dead stock before it sinks cash starts with seeing how much of your cash is parked in products that have stopped moving.
Inventory accuracy and shrinkage measure whether you can trust the numbers at all. Accuracy is the share of counted items that matched your system; shrinkage is the stock that’s gone missing, recorded minus actual over recorded.
Both come out of counting, and building records you can trust is the precondition for every other KPI here, because a turnover or GMROI figure built on bad counts is just a confident wrong answer.
| Inventory KPI | What it flags | Where to go deeper |
| In-stock / stockout rate | Sales you’re losing to being out of stock | The full cost of a stockout and how to prevent it |
| Inventory aging | Cash freezing in slow-moving stock | How to spot aging stock before it turns dead |
| Dead stock share | Product that has stopped selling entirely | How to clear dead stock before it sinks cash |
| Accuracy & shrinkage | Records you can’t trust and stock you’re losing | How to measure and fix accuracy and shrinkage |
Cost: What is your inventory costing you to hold?
The speed and profit KPIs don’t show the running bill for holding stock, and that bill is real. Inventory carrying cost rolls it into one number: your annual holding cost divided by average inventory value, as a percentage.
It bundles warehousing, the capital tied up, insurance, and the risk of obsolescence, damage, and shrink.
Estimates vary, but the cost of holding stock is commonly put around 20% to 30% of inventory value a year, so treat that as a labeled range to pressure-test against your own numbers, not a law.
On $200,000 of average inventory, a 25% carrying cost is about $50,000 a year, whether or not that stock ever sells.
Carrying cost is where the other metrics meet the money. Slow-turning stock with a weak GMROI isn’t a separate problem; it’s the same problem seen from the cost side, quietly charging you a fifth to a third of its value every year it lingers. That’s why the aging read matters, and why cutting a stubborn, low-return SKU often frees more cash than one more marketing push.
Which inventory KPIs should you track?
Track the three to five KPIs that map to a decision you’ll act on this month, and keep the rest as diagnostics you pull when a headline number moves. A short, decision-linked set gets looked at; a twenty-metric dashboard gets ignored.
Benchmarks vary by category and shift over time, so the trend against your own history beats any universal target.
Check the fast-moving reads: weeks of cover and in-stock rate, weekly, and the slower structural ones: turnover, GMROI, and aging, monthly.
These are the numbers that feed how you plan your inventory, and they point to what to fix next. The rest are diagnostics: pull carrying cost, accuracy, or shrinkage when one of your core numbers drifts, and you need to know why. A practical starting set:
- Inventory turnover or days on hand: Are we leaner than last quarter, and is cash starting to free up?
- GMROI: Which products earn their shelf space, and which should you cut or reprice?
- Weeks of cover: What do you reorder and when, so the buying plan stays ahead of demand?
- In-stock rate: Where are you losing sales because the product ran out?
- Inventory aging: What should you promote or mark down before it turns into dead stock?
Frequently asked questions
What are inventory KPIs?
Inventory KPIs are metrics that measure how well your inventory is performing, such as how fast it sells (inventory turnover), how much margin it earns per dollar invested (GMROI), how much of a buy you’ve cleared (sell-through rate), and how much cash it ties up (carrying cost).
What are the most important inventory KPIs for ecommerce?
For most ecommerce brands, the core set is inventory turnover or days inventory on hand, GMROI, weeks of cover, in-stock rate, and inventory aging, because each one maps directly to a reorder, pricing, or markdown decision.
How do you calculate inventory turnover?
Divide your cost of goods sold for a period by your average inventory at cost for that period; for example, $600,000 in COGS on $150,000 of average inventory is a turnover of 4.
What is GMROI and what is a good GMROI?
GMROI, gross margin return on investment, is gross margin dollars divided by average inventory cost, and anything above 1 means your inventory earns back more than a dollar of margin per dollar tied up; a good GMROI varies by category, so compare against similar products and your own trend.
What is the difference between inventory turnover and GMROI?
Inventory turnover measures how fast stock sells, while GMROI measures how much margin that stock earns per dollar invested, so GMROI catches a product that turns quickly but makes little money.
How often should I review inventory KPIs?
Review fast-moving reads like weeks of cover and in-stock rate weekly, and slower reads like turnover, GMROI, and inventory aging monthly, so you act on availability quickly and on structural trends deliberately.
What is a good inventory turnover ratio?
It depends heavily on your category, so judge it against similar businesses and your own history rather than a single universal number; the trend matters more than the absolute figure.
Where do inventory KPIs come from?
They come from your sales and inventory data, your COGS, and your on-hand and received counts, which is why accurate records are the precondition for trusting any of these numbers.
