
Return one order in five and the “average” return rate stops being an abstraction. The average ecommerce return rate runs close to 19% of online orders, but that headline hides an enormous spread: apparel comes back four to ten times as often as jewelry.
Benchmarking against the overall number tells you almost nothing about whether your rate is healthy — you need the figure for what you sell.
This guide gives the 2026 return-rate benchmarks by category, drawn from the National Retail Federation’s 2025 Retail Returns Landscape, explains why the spread is so wide, and shows what returns cost you in margin. Find your category, compare your rate, and treat anything creeping above the range as a signal to act.
What’s the average ecommerce return rate?
About 19.3% of online orders were returned in 2025, compared with 15.8% across all retail, according to the NRF and Happy Returns 2025 Retail Returns Landscape. Online rates run higher than in-store because shoppers can’t touch the product first, so more of what arrives doesn’t fit, match, or match expectations.
For scale, U.S. shoppers sent back $849.9 billion of merchandise in 2025, and the overall rate held roughly steady against 16.9% the year before. The online figure is the one to hold onto: near 19%, close to double the all-retail number, and still an average that flattens a category spread running from about 4% to 40%.
That spread is why the table below matters more than any single headline.
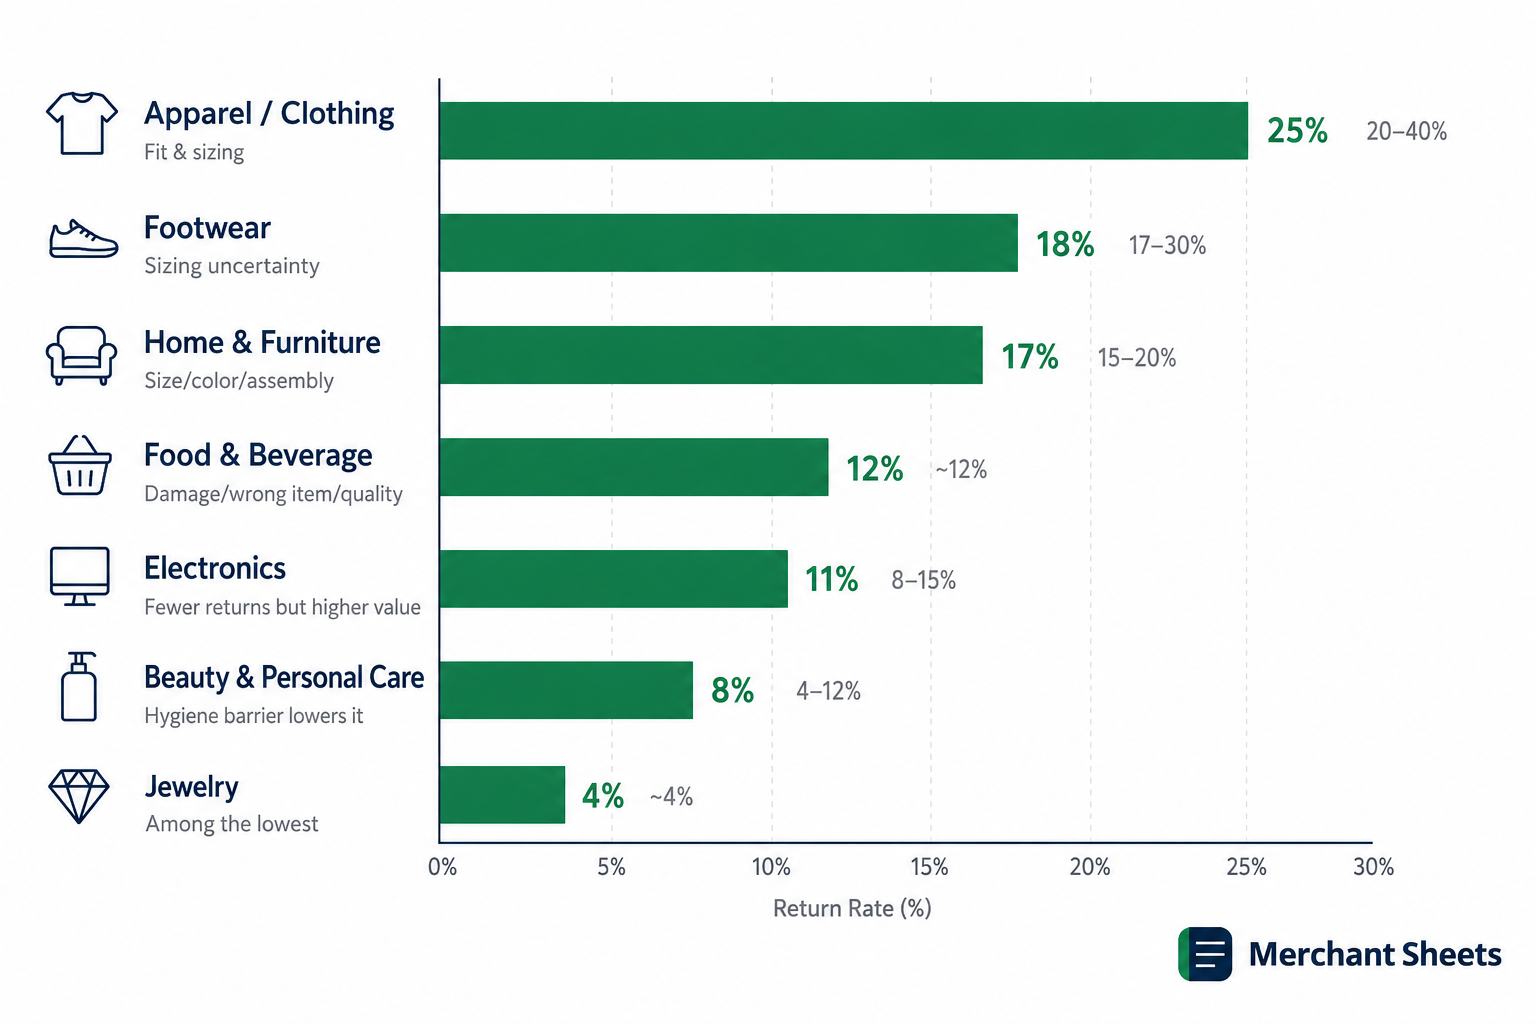
Ecommerce return rates by category (2026)
Return rate is set less by how you sell and more by what you sell. Fit-driven categories sit at the top; hygiene-barrier and considered-purchase categories sit at the bottom.
The ranges below are directional, aggregated across industry data and the category ranking reported by Statista, so read them as a band your rate should fall inside rather than a single target.
Table 1: Directional ecommerce return-rate ranges by category, 2026 (headline rates per NRF; category ranges aggregated from industry data).
| Category | Typical return-rate range | Main driver |
|---|---|---|
| Apparel / clothing | 20–40% (avg ~25%) | Fit and sizing |
| Footwear | 17–30% (~18%) | Sizing uncertainty |
| Home & furniture | 15–20% | Size, color, assembly |
| Food & beverage | ~12% | Damage, wrong item, quality |
| Electronics | 8–15% (~11%) | Fewer returns, higher value each |
| Beauty & personal care | 4–12% | Hygiene barrier lowers it |
| Jewelry | ~4% | Among the lowest |
Read the table against your own mix. A brand selling mostly apparel should expect a quarter of orders back and build that into its economics; an electronics or jewelry seller running double-digit returns has a problem worth investigating.
For the full U.S. picture, Statista’s e-commerce returns data tracks the ranking over time.
Why apparel and footwear top the list
Fit and sizing drive the bulk of clothing returns — by some estimates up to 70% of them. A shopper can’t try a shirt on through a screen, so many buy to test and send back what doesn’t work. Two behaviors make it worse.
- Bracketing: Ordering the same item in two or three sizes with the plan to keep one and return the rest. It’s now common enough that the NRF calls it out as a structural cost, and it lands hardest on apparel and footwear.
- Free-return expectations: Free returns are a major purchase consideration for 82% of shoppers, which lowers the friction of sending something back and nudges the rate up across every fit-driven category.
Why some categories stay low
At the other end, beauty and jewelry sit low for a simple reason: the hygiene barrier and the considered nature of the purchase. Opened cosmetics often can’t be resold, so many retailers don’t accept them back, and a jewelry buyer tends to decide carefully before checkout. Lower return rates follow from both.
What a high return rate costs you
Every return pulls straight from your variable cost math. You refund the sale, so the revenue is gone, and you still pay to ship the order out, ship it back, and process it on arrival — then often resell the unit at a markdown or write it off. A return is one of the most expensive events in the whole order lifecycle.
| A single return costs you the sale plus outbound shipping, return shipping, and processing — and often a markdown on the returned unit. On a thin-margin product, two or three returns can wipe out the profit from a dozen clean orders. |
The math gets sharper on marketplaces. On Amazon, a return stacks a returns-processing fee and lost fulfillment on top of the fees you already paid, which is why returns on Amazon can turn a marginal SKU negative.
Wherever you sell, the honest way to model returns is as a variable cost that comes straight out of contribution margin, not a rounding error at the bottom of the P&L.
What’s a good return rate for your store?
A good return rate is at or below the range for your category, not the 19% overall average. An apparel brand at 22% is doing well; an electronics brand at 22% is bleeding money.
Benchmark against your own row in the table, watch the trend, and treat a rate climbing above your category band as the signal to dig in — the cause is usually sizing, product photography, or description accuracy.
Pair the metric with your fulfillment cost per order to see the full delivered-and-returned cost of serving a customer.
How to track and lower your return rate
Return rate is one of the operational ecommerce KPIs that’s simple to calculate and hard to move, so start by measuring it consistently, then work the levers that reduce it.
- Calculate it: divide returned orders (or units) by total orders over the same period. Pick one basis and keep it consistent.
- Review it monthly and at the SKU level, since one bad-fitting product can drag the whole blended rate.
- Tighten sizing guidance with real measurements and fit notes, the single biggest lever in apparel.
- Improve photography and descriptions so the product that arrives matches what the shopper pictured.
- Fix quality and packaging issues that show up as damage or “not as described” returns.
Track returns before they cost you a quarter
A return rate you don’t track quietly eats the margin you worked to earn. The KPI Dashboard puts return rate next to contribution margin, CAC, and cash in one view, so you catch it climbing early.
Frequently asked questions
What’s the average return rate for online stores?
About 19.3% of online orders were returned in 2025, per the NRF and Happy Returns 2025 Retail Returns Landscape, versus 15.8% across all retail. Online rates run higher because shoppers can’t inspect the product before buying.
Which category has the highest return rate?
Apparel has the highest return rate, commonly 20–40% and averaging around 25%, because fit and sizing drive most clothing returns. Footwear follows closely at roughly 17–30% for the same reason.
Is a 20% return rate bad?
A 20% return rate is normal for apparel and footwear but high for electronics, beauty, or jewelry, where healthy rates sit in the single digits to low teens. Whether 20% is bad depends entirely on your category, so benchmark against your own row, not the overall average.
How do you calculate return rate?
Divide the number of returned orders by the total number of orders over the same period, then multiply by 100. You can run it on units instead of orders; keep the basis consistent so the trend stays comparable month to month.
