
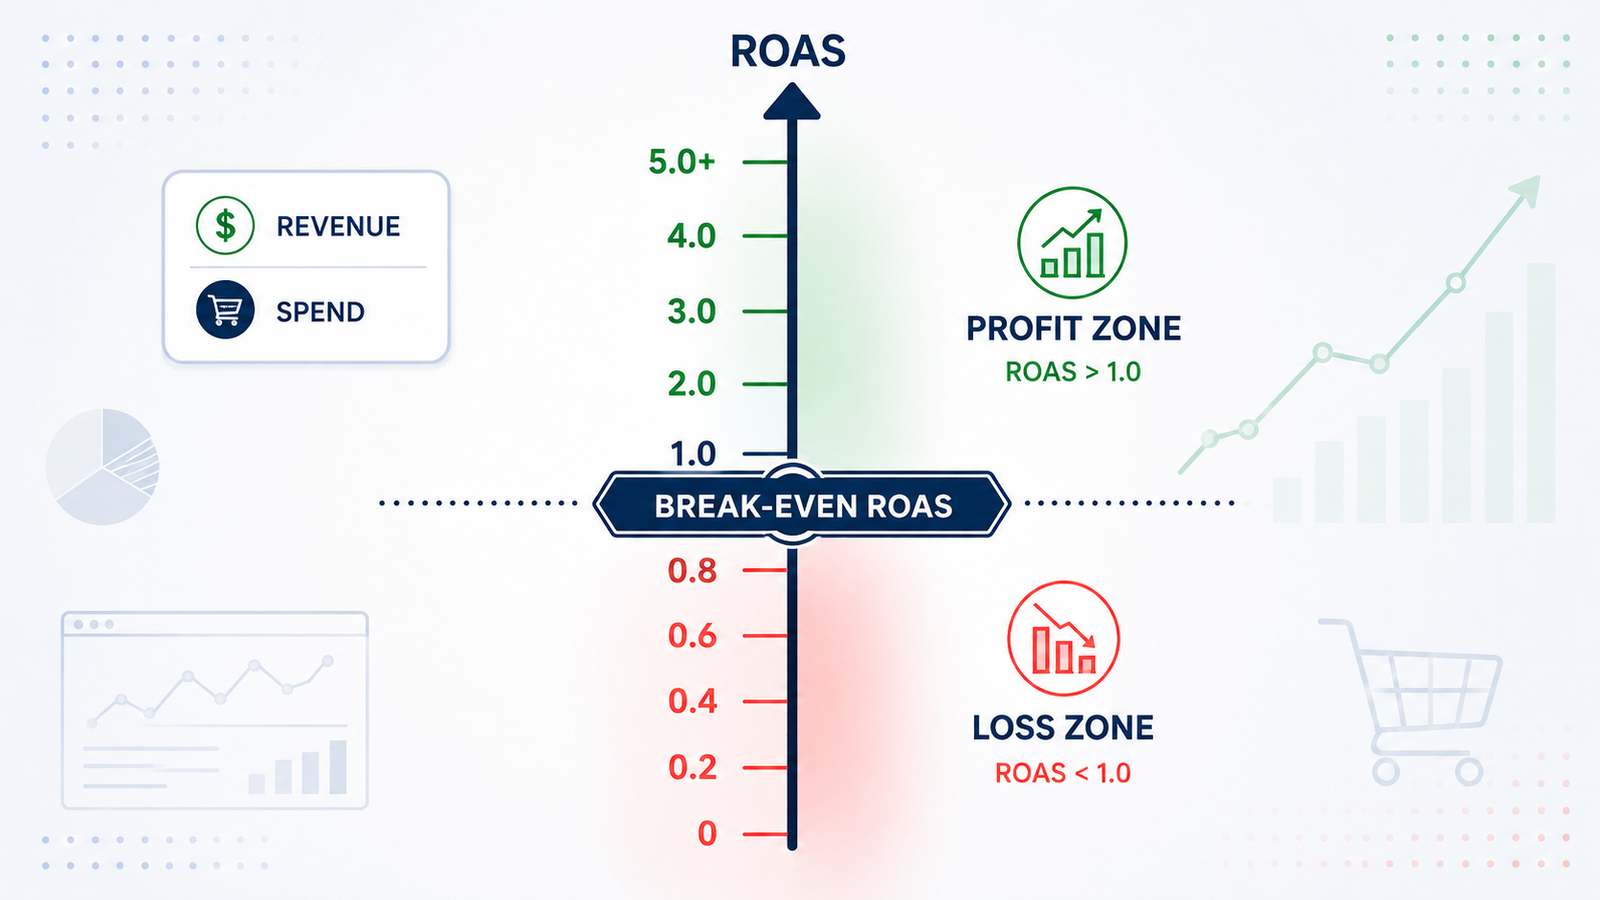
Break-even ROAS is the return on ad spend (ROAS) where a sale exactly covers its own costs — the product, the fees to sell it, and the ad that brought the customer in. Spend more than that to win the sale and you lose money on it; spend less and you keep the difference. This one number sets the ceiling on what you can pay to make a sale.
This guide gives you the break-even ROAS formula, a worked example on a $40 order, and the step that turns break-even into a profit target you can hold each channel to.
What is break-even ROAS?
Break-even ROAS is the return on ad spend at which an order’s revenue exactly covers its variable costs plus the ad spend that won it. At your break-even ROAS you make no profit and take no loss on the sale. Below it, the order loses money; above it, it earns a profit.
Think of it as a guardrail on every order. ROAS measures revenue for each dollar of ad spend, so a ROAS of 3 means $3 back for every $1 spent. Your break-even ROAS marks the exact point where those ad dollars have paid for themselves and the product behind them. Once you know it, any campaign reading below the line is spending you into a loss.
The break-even ROAS formula
The formula is one line: break-even ROAS = 1 ÷ contribution margin, using the margin before ad spend. If a product keeps 60% of its price after the cost of making and delivering it, the break-even ROAS is 1 ÷ 0.60, or 1.67. You need $1.67 in revenue for every $1 of ad spend to break even on that order.
Break-even ROAS is the reciprocal of margin because the tighter your margin, the more revenue each ad dollar has to bring back to cover it. A 60% margin needs a 1.67 ROAS; a 40% margin needs 2.5; a 25% margin needs 4.0. Thinner margins raise the bar every ad campaign has to clear.
The margin you divide by is your contribution margin before acquisition costs — the CM2 rung, after product cost, fees, and shipping, but before advertising. Leave the ad cost out of the margin here, because the ad spend is the very thing you’re solving for.
Count the ad spend once. Use your margin before ad spend — it’s what you’re solving for, so it can’t sit inside the margin too.
A worked example
Say you sell a $40 candle. Before you spend a cent on ads, here’s what the order costs you to make and ship:
| Line item | Amount |
| Selling price | $40.00 |
| Product cost, or cost of goods sold (COGS) | −$12.00 |
| Payment processing | −$1.20 |
| Pick, pack & ship | −$2.80 |
| Contribution before ad spend | $24.00 |
| Contribution margin before ad spend | 60% |
| Break-even ROAS (1 ÷ 60%) | 1.67 |
A break-even ROAS of 1.67 means that once a campaign selling this candle returns less than $1.67 for every $1 spent, you’re paying to lose money. To run the same math on one of your own products:
- Add up the variable costs on one order before advertising: product cost, payment fees, pick-pack-ship, and shipping net of what the customer pays.
- Subtract them from the selling price, then divide by the price: that’s your contribution margin before ad spend.
- Divide 1 by that margin: the result is the ROAS where the order breaks even.
Break-even ROAS vs target ROAS
Break-even ROAS only gets you to zero on the sale. It covers the product and the ad, and stops there. Fixed costs — rent, salaries, software — and any profit all have to come from ROAS above the break-even line.
So the number you manage to in practice is a target ROAS, set above break-even by the profit you want to keep. The step is small: target ROAS = 1 ÷ (contribution margin − your target profit margin). On the $40 candle, if you want to keep 10% of revenue as profit, that’s 1 ÷ (60% − 10%), or 1 ÷ 0.50 — a target ROAS of 2.0. Raise the profit you want and the target climbs with it, which is why healthy budgets are built around a target ROAS rather than the break-even floor.
Break-even tells you where you start losing money. Your target tells you where the order pays for the business and leaves something over. You need both: one is the floor, the other is the goal.
Break-even ROAS, MER, and your max CAC
Break-even ROAS works per campaign or per product. Across the whole business, the same math runs on your marketing efficiency ratio (MER) — total revenue divided by total ad spend. Break-even MER is 1 ÷ your blended contribution margin, and it’s the honest read when overlapping campaigns and organic sales muddy any single campaign’s ROAS.
Turn break-even ROAS around and it also tells you how much you can spend to acquire a customer. The contribution left on an order is your ceiling on customer acquisition cost (CAC): once acquisition eats past that contribution, the order stops paying for itself. Break-even ROAS and max CAC are the same limit, read as a ratio or as a dollar figure.
These numbers move week to week as ad costs, fees, and returns shift. A tracker that watches spend against revenue by channel keeps your break-even line in view, so a channel slipping under it shows up while you can still act on it.
Frequently asked questions
Is a higher or lower break-even ROAS better?
A lower break-even ROAS is better, because it means each order carries a wider margin and needs less revenue per ad dollar to pay for itself. A product with a 70% margin breaks even at a 1.43 ROAS, while a 30%-margin product has to hit 3.33 before it stops losing money.
What’s a good ROAS for ecommerce?
A good ROAS is any figure comfortably above your own break-even ROAS, which depends on your margins rather than a single universal number. As of early 2026 many direct-to-consumer (DTC) brands manage to a blended 2x-4x, but a high-margin brand can thrive below that while a thin-margin one needs more.
How is break-even ROAS different from break-even ACoS?
Break-even ROAS and break-even ACoS mark the same point from opposite directions: ROAS is revenue divided by ad spend, while advertising cost of sales (ACoS) is ad spend divided by revenue. A break-even ROAS of 1.67 is the same break-even point as a break-even ACoS of 60%, which is why Amazon sellers who work in ACoS land on the identical answer.
Put your break-even ROAS to work
A break-even ROAS on paper is a starting point. The work is holding each channel to it once spend, fees, and returns start moving. The ROAS / MER Tracker pulls your spend and revenue into one view and flags any channel running below its break-even line, so you catch the leak before the month closes. See where each channel really stands.
