
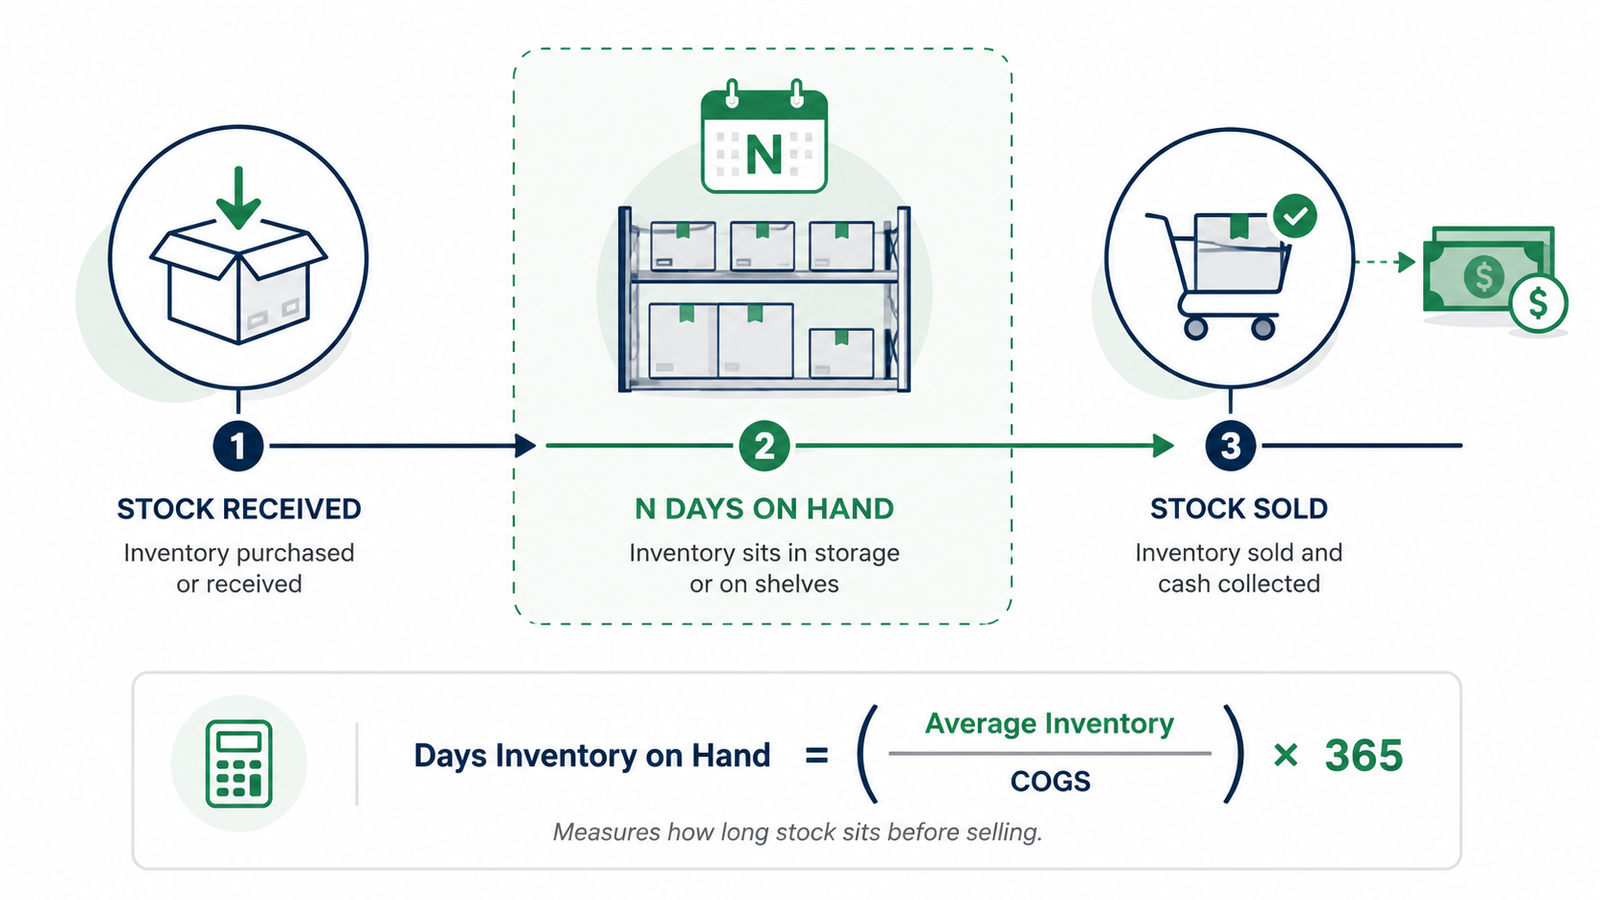
Days inventory on hand tells you how many days your stock sits before it sells. It’s the plainest read on how long your cash is locked up as inventory, and whether you’re carrying more than your category needs. It’s also one piece of a wider inventory planning system that decides how much to buy and when.
This guide covers what days inventory on hand is, how to calculate it, a healthy benchmark by vertical, what a high or low number tells you, how it feeds the cash conversion cycle, and the levers that bring it down.
What is days inventory on hand?
Days inventory on hand is the average number of days a business holds its stock before selling it. A store carrying 60 days on hand sells through its inventory about every two months. A lower number means stock moves quickly and cash comes back fast; a higher number means cash is sitting on the shelf.
You’ll see the same metric under three names: days inventory on hand, days inventory outstanding (DIO), and days sales of inventory (DSI). They measure the same thing — how long inventory sits before it sells — so treat them as interchangeable and use whichever name your reports already carry.
The days inventory on hand formula
Days inventory on hand divides your average inventory by the cost of goods sold, then multiplies by the number of days in the period — usually 365 for a full year:
Days inventory on hand = (average inventory ÷ COGS) × 365
Average inventory is the stock you held on average over the period, valued at cost: (beginning inventory + ending inventory) ÷ 2. Cost of goods sold (COGS) is the direct product cost of everything you sold in that period.
Both figures sit at cost, so the ratio compares like with like.
Take a store that sold $500,000 of product at cost over the year and held $100,000 of inventory on average. Its days inventory on hand is ($100,000 ÷ $500,000) × 365 = 73 days. On average, a unit sits in the warehouse about ten weeks before it ships.
Table 1. Days inventory on hand worked from average inventory and COGS.
| Input | Value |
| Average inventory (at cost) | $100,000 |
| COGS (annual, at cost) | $500,000 |
| Average inventory ÷ COGS | 0.20 |
| × 365 days | × 365 |
| Days inventory on hand | 73 days |
The shortcut from turnover
If you already track inventory turnover, there’s a faster route. Turnover counts how many times you sell through your average stock in a year, and days on hand is the same speed expressed in days:
Days inventory on hand = 365 ÷ inventory turnover
The store above turns its inventory 5 times a year ($500,000 COGS ÷ $100,000 average inventory). Divide 365 by 5 and you land on the same 73 days. Turnover and days on hand are two views of one number — turns for speed, days for how long your cash is tied up.
What’s a healthy days inventory on hand?
A healthy days inventory on hand depends on your category. As a rule of thumb, most DTC stores land between 30 and 60 days, but that band hides big differences: grocery and perishables run far lower, while furniture and other high-value goods run much higher and still operate well.
Table 2. Typical days inventory on hand by ecommerce vertical, as of early 2026. Ranges vary widely by catalog.
| Ecommerce vertical | Typical days on hand |
| Food & beverage | 25–30 days |
| Supplements | 30–45 days |
| Pet | 35–45 days |
| Beauty & personal care | 40–90 days |
| Fashion & apparel | 50–90 days |
| Electronics | 60–90 days |
| Home & furniture | 75–120 days |
Read your number against your own vertical and your own trend, not a blended average. A 70-day figure is heavy for supplements and lean for furniture.
What matters more than the absolute number is the direction: a days-on-hand figure creeping up quarter over quarter means cash is backing up in stock.
What a high days inventory on hand tells you
A high days inventory on hand means stock is sitting longer than it should. The usual causes are over-ordering, softening demand, a bloated assortment, or a forecast that ran ahead of real sales.
Whatever the source, the effect is the same: cash you already spent is parked on the shelf instead of funding your next order — cash tied up in inventory that can’t be spent on anything else.
That parked cash carries real costs. You’re paying to store and insure it, it’s exposed to damage and markdowns, and the longer it sits the closer it drifts toward dead stock you’ll have to discount to clear.
Every extra day on hand is a day that money stays stuck.
What a low days inventory on hand tells you — and when it’s too low
A low days inventory on hand means stock moves quickly and your cash cycles fast, so you’re not tying up money in shelves of unsold goods. Up to a point, that’s the goal. Lean inventory is efficient inventory, and it’s the sign of a catalog that sells what it buys.
Past that point, a low number turns into a problem. When days on hand drops below the buffer your lead times need, you start stocking out — lost sales, rushed reorders at air-freight rates, and customers who bought elsewhere.
The aim is days of stock matched to demand plus a safety stock buffer, not the lowest figure you can post.
Days inventory on hand and the cash conversion cycle
Days inventory on hand is one leg of a bigger cash measure. The cash conversion cycle tracks how long your money is tied up from the day you pay for stock to the day you collect on the sale, and it’s built from three day-counts:
Cash conversion cycle = days inventory on hand + days sales outstanding − days payable outstanding
Days sales outstanding is how long customers and channels take to pay you; days payable outstanding is how long your suppliers give you before you pay them.
Days on hand is the inventory piece — often the largest for a product business, because that’s where the most cash sits. Shorten it and you shorten the whole cycle, which frees cash without borrowing.
How to lower days inventory on hand
Every lever below moves stock off the shelf faster or keeps less of it there to begin with. Two cautions first: cutting days too aggressively risks stockouts, so pair any push with a buffer; and chasing a lower number with markdowns can erode margin, so watch GMROI alongside days on hand.
The levers that bring the number down:
- Forecast demand more tightly: When your purchase orders track real sell-through instead of gut feel, you stop over-buying the slow movers that pad your days on hand.
- Order smaller and more often: Shorter, more frequent orders keep less cash on the shelf at any one time, where your supplier terms and minimum order quantities allow it.
- Clear slow movers: Discount, bundle, or liquidate the SKUs that sit longest, so aging stock stops dragging your average up.
- Prune the assortment: Cutting SKUs that never earned their shelf space frees cash and warehouse room for the products that turn.
- Tighten reorder points to real lead times: Setting reorder triggers to your actual supplier lead time plus a buffer stops you from holding weeks of extra stock as a cushion you don’t need.
Track your days of cover per SKU
A single blended days-on-hand number tells you the store is heavy without telling you which SKUs are the problem.
The Inventory Management Base holds cost and stock position per SKU and computes days of cover, reorder status, and ABC tier, so the overstocked items tying up your cash surface on the dashboard — in Excel or Google Sheets.
See where your days are hiding, and clear them.
Frequently asked questions
What is a good days inventory on hand?
A good days inventory on hand is one that matches your category and trends flat or downward over time. Most DTC stores run between 30 and 60 days, but grocery and perishables sit well under 30 while furniture and other durables can run past 100 and still be healthy. Compare against your own vertical and your own history rather than a single universal target.
How do you calculate days inventory on hand?
Divide your average inventory by your cost of goods sold for the period, then multiply by the number of days in it: (average inventory ÷ COGS) × 365 for a year. A store with $100,000 of average inventory and $500,000 in annual COGS has 73 days on hand. If you already know your inventory turnover, the shortcut is 365 divided by the turnover ratio.
What’s the difference between days inventory on hand and inventory turnover?
They’re the same efficiency measured two ways: inventory turnover counts how many times you sell through your stock in a year, while days inventory on hand converts that into how many days a unit sits before selling. A turnover of 5 and 73 days on hand describe the same store — divide 365 by one to get the other.
Is a lower days inventory on hand better?
Lower is better up to the point where it starts causing stockouts. A shorter days-on-hand figure means less cash tied up in stock and faster turnover, but drop below the buffer your lead times need and you’ll lose sales to empty shelves. The target is days matched to demand plus a safety buffer, not the lowest possible number.
Are days inventory on hand, DIO, and days sales of inventory the same thing?
Yes, days inventory on hand, days inventory outstanding (DIO), and days sales of inventory (DSI) all measure the same thing: the average number of days stock sits before it sells. Different textbooks and tools favor different names, and some use average inventory while others use ending inventory, so check which your source uses, but the concept is identical.
