
Key takeaways
- An ecommerce financial model turns driver assumptions (orders, AOV, costs, inventory days) into three linked statements: a P&L, cash flow, and balance sheet.
- Build it in four layers: an assumptions tab, a monthly engine, the three statements, and a dashboard. Every input lives on the assumptions tab, which keeps it auditable.
- Model revenue per channel (DTC and marketplace) as orders × AOV minus returns, then take costs off in stages to reach gross profit, EBITDA, and net income.
- A profitable store can still run out of cash: inventory is paid for months before it sells. Model the cash conversion cycle (DSI + DSO − DPO) so the forecast holds.
- Trust the model only when two checks hold: the balance sheet balances every period, and ending cash on the cash flow matches the balance sheet.
An ecommerce financial model is your business on a spreadsheet: a set of assumptions that flows into a profit and loss statement, a cash flow statement, and a balance sheet that all move together. Build one and you can test a price change, a new hire, or a big inventory order before you spend a dollar finding out how it lands.
Most operators run their store on a bank balance and a gut feel. A model turns that into a forecast you can question.
This guide builds one the way we build ours — assumptions first, then a monthly engine, then the three statements it feeds, and a dashboard on top. You’ll get the revenue drivers, the cost lines, the working-capital step most templates skip, and the two checks that prove the whole thing balances.
What is an ecommerce financial model?
An ecommerce financial model is a driver-based forecast that turns a handful of assumptions — orders, average order value, product cost, marketing, inventory days — into three linked financial statements. Change one input and the P&L, cash flow, and balance sheet all update together, so you see the effect of a decision before you commit to it.
That linkage is what separates a model from a budget. A budget is a single set of target numbers for the year. A model is the machine that produces those numbers from drivers you can change, which is why it’s built as a three-statement model — one where the profit and loss statement, the cash flow statement, and the balance sheet are wired to each other.
Profit shows up on the P&L, but the cash to fund inventory and the debt you carry only show up once all three tie together.
What goes into the model: the four layers
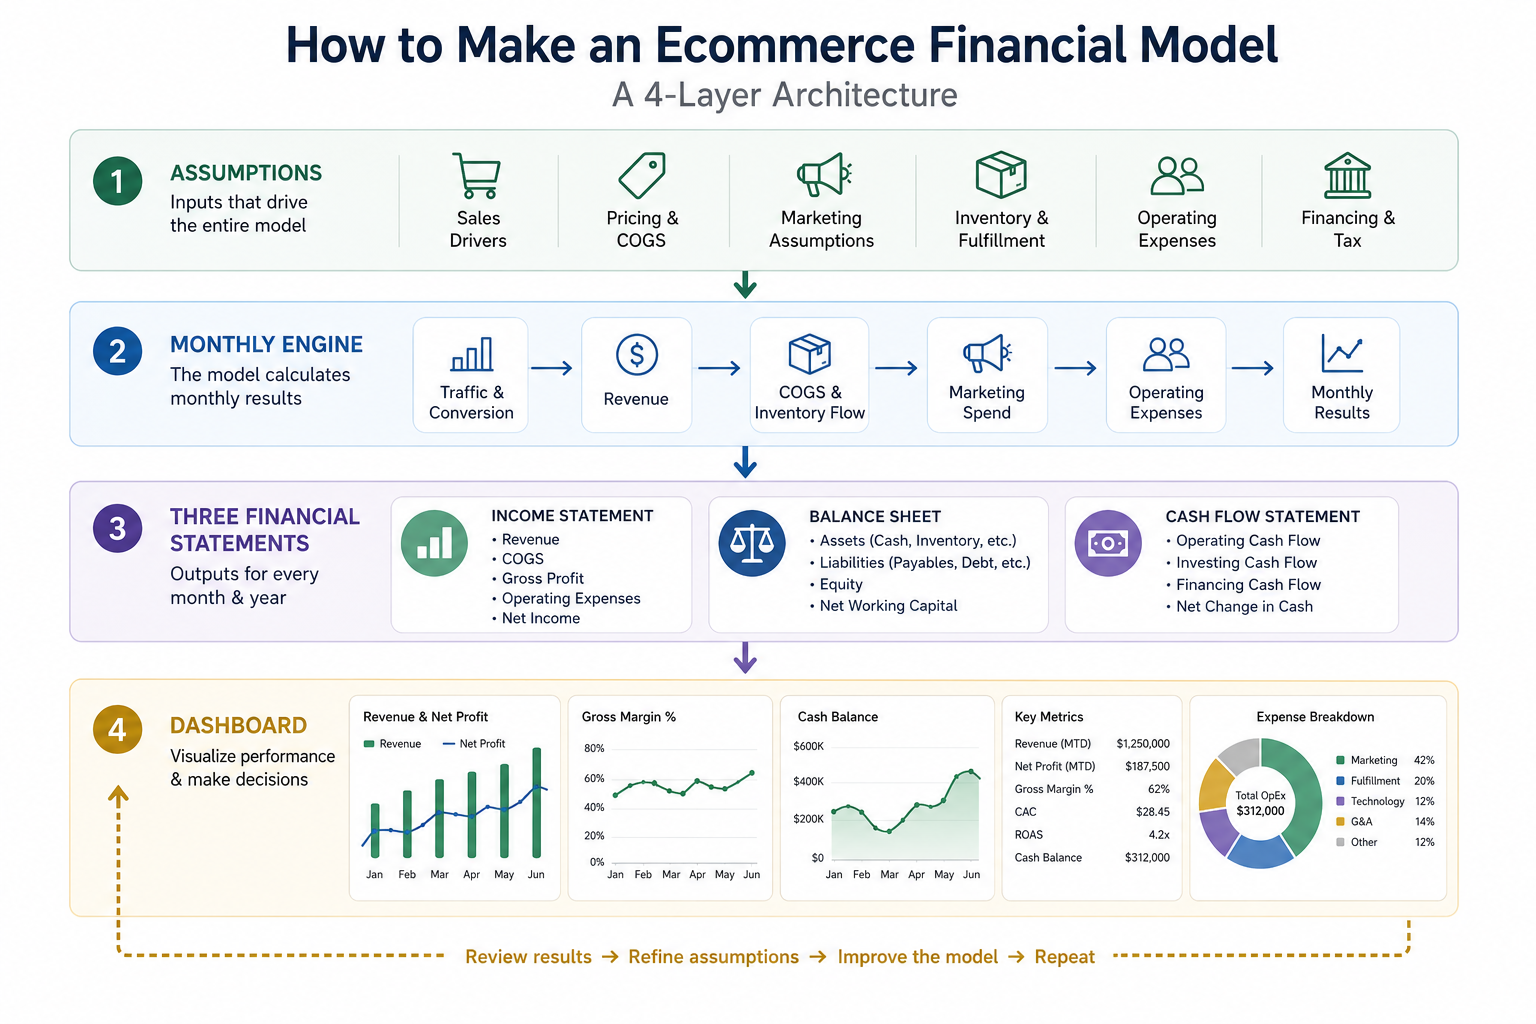
A good model is built in layers so you only ever touch the part meant to be edited. Ours has four: an assumptions tab that holds every input, a monthly engine that does the math, the three statements it feeds, and a dashboard that surfaces the headline numbers.
One rule keeps the whole thing auditable — every business input lives on the assumptions tab, and everything else is a formula. If a number is hardcoded somewhere in the middle of a statement, you’ve planted a bug you’ll never find.
Here’s the full build, in the order you’d construct it:
- Set your assumptions: Put every input — pricing, growth, costs, inventory days, financing, tax rate — on one tab.
- Build the revenue engine: Drive sales from orders, growth, and average order value across your channels.
- Layer in COGS: Subtract product, freight, fulfillment, and platform fees to reach gross profit.
- Add operating expenses: Take out marketing, payroll, rent, and software to reach operating profit.
- Model working capital: Set inventory, receivable, and payable days to see how much cash the business ties up.
- Add capex, financing, and taxes: Fund the business with equity and debt, then depreciate assets and apply the tax rate.
- Assemble the three statements: Roll the engine into the P&L, balance sheet, and cash flow, monthly and annually.
- Build the dashboard and check it balances: Surface the KPIs, then confirm the balance sheet balances and cash ties out.
Step 1: Set your assumptions
Start with the assumptions tab, because every other number descends from it. Give the model a start month and a horizon — we run 36 months with an annual rollup, which is long enough to show a full growth curve and the working-capital swings that come with it.
Then color-code the tab so future-you knows what’s safe to touch: input cells one color, formulas another. The discipline pays for itself the first time you hand the file to someone else.
Step 2: Build the revenue engine
Revenue is the first thing the engine builds, and in ecommerce it comes from three drivers per channel: how many orders you start with, how fast that order count grows month over month, and your average order value (AOV) — the average dollar value of an order.
Multiply them for gross sales, then subtract returns and refunds to get net revenue. Model your direct-to-consumer store and your marketplace sales as separate channels, since their growth rates, order values, and fees rarely match.
Net revenue = orders × average order value − returns and refunds
Run that month by month and the growth compounds on its own. A store opening at 700 DTC orders a month at 6% monthly growth crosses 1,300 orders by month twelve without touching the formula again. Keep the drivers honest — a growth rate you can’t defend is the fastest way to a model nobody believes.
Tie it to something real, like a marketing budget and a cost per acquisition, rather than a number that only trends up because you’d like it to.
If repeat purchases carry your store, split new and returning orders so the model reflects how a returning customer costs nothing to reacquire. That’s the difference between a forecast that assumes every order is bought with ad spend and one that credits the base you’ve already built.
Step 3: Layer in COGS
Cost of goods sold (COGS) — the direct cost of the goods you sold — is where ecommerce models get sloppy. Don’t drop in one blended percentage. Build it from the pieces that move on their own: product cost as a share of revenue, inbound freight and duty on top of product, pick-pack-ship as a dollar cost per order, payment processing as a percentage of every charge, and marketplace fees on the channel that charges them.
Net revenue minus all of that is gross profit, the money left to run the business.
Gross profit = net revenue − COGS
Step 4: Add operating expenses
Operating expenses come next, and they behave differently from COGS: most are fixed or step up in chunks rather than rising with each order. Marketing usually scales as a percentage of revenue, so it belongs with the variable costs, but payroll, rent, software, and the rest hold steady until you decide to add.
Model salaries as a figure that steps up by year as you hire, not a smooth percentage — real teams grow in hires, and a stepped line shows the margin dip each one causes. Subtract operating expenses from gross profit and you’ve reached operating profit, or earnings before interest, taxes, depreciation, and amortization (EBITDA).
A compact annual view makes the shape clear. These are illustrative Year 1 figures for a store doing $1.4M in net revenue:
| Line | Year 1 | % of net |
| Net revenue | $1,400,000 | 100% |
| COGS | $770,000 | 55% |
| Gross profit | $630,000 | 45% |
| Marketing | $224,000 | 16% |
| Payroll, rent & other opex | $290,000 | 21% |
| EBITDA | $116,000 | 8% |
Step 5: Model working capital
A profitable store can still run out of cash. Ecommerce ties up money in inventory you pay for months before you sell it, so profit on the P&L and cash in the bank drift apart.
The working-capital step is where the model catches that gap, and it’s the section generic templates skip — which is exactly why their cash forecasts look fine right up until they’re wrong.
You model it with three inputs, all measured in days. Days sales of inventory (DSI) is how long stock sits before it sells; days sales outstanding (DSO) is how long customers take to pay; and days payable outstanding (DPO) is how long you take to pay suppliers.
Net them together and you get the cash conversion cycle (CCC) — how long a dollar is tied up between paying for inventory and collecting on the sale. The longer the cycle, the more cash your growth quietly swallows.
Cash conversion cycle = DSI + DSO − DPO
Pull the days from your own numbers rather than guessing. DSI is average inventory divided by daily COGS; DSO comes from how your processors and any wholesale terms pay out; DPO is the terms your suppliers actually give you, not the ones you wish you had.
Most DTC stores collect from customers almost immediately, so the cycle lives or dies on inventory days and supplier terms — which is why negotiating 15 more days from a supplier can free more cash than a good sales month.
This is the number that decides how much cash you need to fund growth. It’s also where net working capital comes from, and why doubling sales can shrink your bank balance instead of growing it.
| The trap: A store growing 40% a year on 75-day inventory has to buy the next, bigger order before the last one is paid for. On paper it’s profitable. In the bank it’s negative. Model DSI, DSO, and DPO or the cash line will lie to you. |
Step 6: Add capex, financing, and taxes
A few inputs finish the picture. Capital expenditure covers the assets you buy up front and maintain over time; depreciate them over a useful life so the cost spreads across the years they serve.
Financing is how you fund the gap — an opening equity contribution plus a term loan, where the principal, interest rate, and term drive an interest expense on the P&L and a principal repayment on the cash flow. Last, apply an effective tax rate to pre-tax profit to reach net income.
Keep the debt on its own small schedule so the split between interest and principal stays clean: interest is an expense that hits profit, while principal repayment is a cash movement that never touches the P&L. Getting that split wrong is one of the most common reasons a home-built model stops balancing.
Step 7: Assemble the three statements
Now the payoff, and the reason it’s worth building all three statements. Net income flows to retained earnings on the balance sheet and sits at the top of the cash flow statement. The working-capital changes you modeled — inventory, receivables, payables — become cash movements.
Capex, debt draws, and repayments close the loop. When it’s wired correctly, the three statements aren’t three reports; they’re one model viewed three ways, and that’s what lets you trust the cash number.
Step 8: Build the dashboard and check it balances
You run two checks, and if either fails the model is wrong. First, the balance sheet has to balance: assets equal liabilities plus equity, every period.
Second, the ending cash on the cash flow statement has to match the cash line on the balance sheet.
Build both as live formulas that flag a difference, so a broken link shows up the moment you create it instead of a quarter later.
With the checks passing, the dashboard is where you read the model. It surfaces the numbers a founder looks at first — revenue, gross margin, EBITDA, the cash balance, and runway — alongside the KPIs on the dashboard that tell you whether the plan is working.
A model that balances but never gets read is a filing exercise. The dashboard is what turns it into a decision tool you open every month.
How detailed should an ecommerce financial model be?
Detailed enough to answer the decision in front of you, and no more. A model that tracks 300 SKUs across five channels is precise and unusable; one built on ten to fifteen assumptions you can each defend is the one you’ll keep current.
Precision you can’t maintain decays into false confidence, so build for the questions you actually ask.
Two design choices set the level. Monthly periods suit most planning and investor conversations, while a weekly cash view earns its place only when cash is tight enough to watch by the week.
On granularity, model at the channel level first and drop to individual SKUs only for the handful that move the number.
The goal is a model you’ll open every month, and detail you can’t sustain is the surest way to stop opening it.
How do you use the model once it’s built?
You drive it. Change the assumptions and watch the statements respond, which is the whole point of building it driver-based.
The same clean model is what a lender or buyer reviews when you go to raise money or value the business, so keeping it current pays off well beyond your own planning. Three habits get the most out of it:
- Run scenarios: Copy the assumptions and build a base, a stretch, and a conservative case so you know the range, not a single guess.
- Reforecast when reality drifts: Update the drivers as real numbers come in, so the plan you’re steering by reflects what you now know.
- Check it against actuals: Each month, compare the model against actuals to see where the forecast held and where it broke.
Skip the blank-sheet weekend
Wiring up three balancing statements from an empty tab is a weekend you won’t get back, and the working-capital and check logic is where most home-built models quietly break.
The Ecom Business Model has the assumptions, the monthly engine, and the three statements already linked and balancing, with the dashboard on top.
Drop in your numbers and forecast. It’s the fastest way to go from a blank sheet to an ecommerce financial model you can steer by.
Frequently asked questions
What should an ecommerce financial model include?
It should include an assumptions tab, a revenue build by channel, a full cost stack down to net income, a working-capital section, and three linked statements with a dashboard on top. The revenue drivers (orders, growth, AOV) and the working-capital days (DSI, DSO, DPO) matter most, because they drive both profit and cash. Anything a bank or a buyer would ask for should trace back to an input you can point to.
Should I build my model in Excel or Google Sheets?
Either works, and the model should run the same in both. Excel is faster on large files and has stronger data tools; Google Sheets wins on sharing and version history. Build with functions both platforms support and avoid macros, and you keep the choice open instead of locking the file to one program.
How often should I update my financial model?
Update the actuals monthly at close, and reforecast the assumptions each quarter or whenever the business changes course. The monthly pass keeps the model honest against reality; the quarterly reforecast resets the plan when growth, costs, or timing have moved. A model you touch once a year is a document, and a document can’t help you decide anything.
Do I need a balance sheet, or is a P&L enough?
You need the balance sheet if you carry inventory, which every physical-goods store does. A P&L shows profit but hides the cash locked in stock and the timing of supplier and customer payments, and that’s where ecommerce cash problems live. The balance sheet and cash flow statement are what turn a profit forecast into a cash forecast you can bank on.
