
Key takeaways
- A profit and loss statement (P&L), also called an income statement, shows what your business earned and spent over a period and what was left, read top to bottom from revenue down to net profit.
- The fastest way to read one is in four margin layers rather than line by line: gross margin, contribution margin, operating income, net profit.
- Begin at net revenue: discounts, refunds, and returns are contra-revenue that come off gross sales first, and treating gross sales as your revenue overstates every margin below it.
- Variable per-order fees like referral, fulfillment, and payment processing belong in cost of goods sold, while the fixed platform plan is an operating expense, and where they sit changes what your margins mean.
- Read each line as a percent of revenue and track it across months and against the same month last year, since one month’s dollar figure can’t tell you whether a number is healthy or drifting.
- A single company-wide P&L can hide a channel or product that loses money on every order, so a healthy blended margin still has to be read by segment.
Your bookkeeper sends a profit and loss statement every month, and it’s easy to skim straight to the bottom line. That number is the least useful part of the page. The story is in how you get there, and an ecommerce P&L has layers a generic one doesn’t.
What is a P&L, and what should it tell you?
A profit and loss statement (P&L), also called an income statement, is the report that shows what your business earned and spent over a set period and the profit or loss left at the end. Read top to bottom, it moves from revenue, through the cost of the products you sold and the cost of running the business, down to what you keep.
The bottom line tells you whether the month worked. It can’t tell you why, or what to change. The value is in the path the statement takes to get there, because each step answers a different question about the business.
The P&L is one of three core financial statements, alongside the balance sheet and the cash flow statement, and it’s the one that answers whether the business is profitable.
An ecommerce P&L, top to bottom
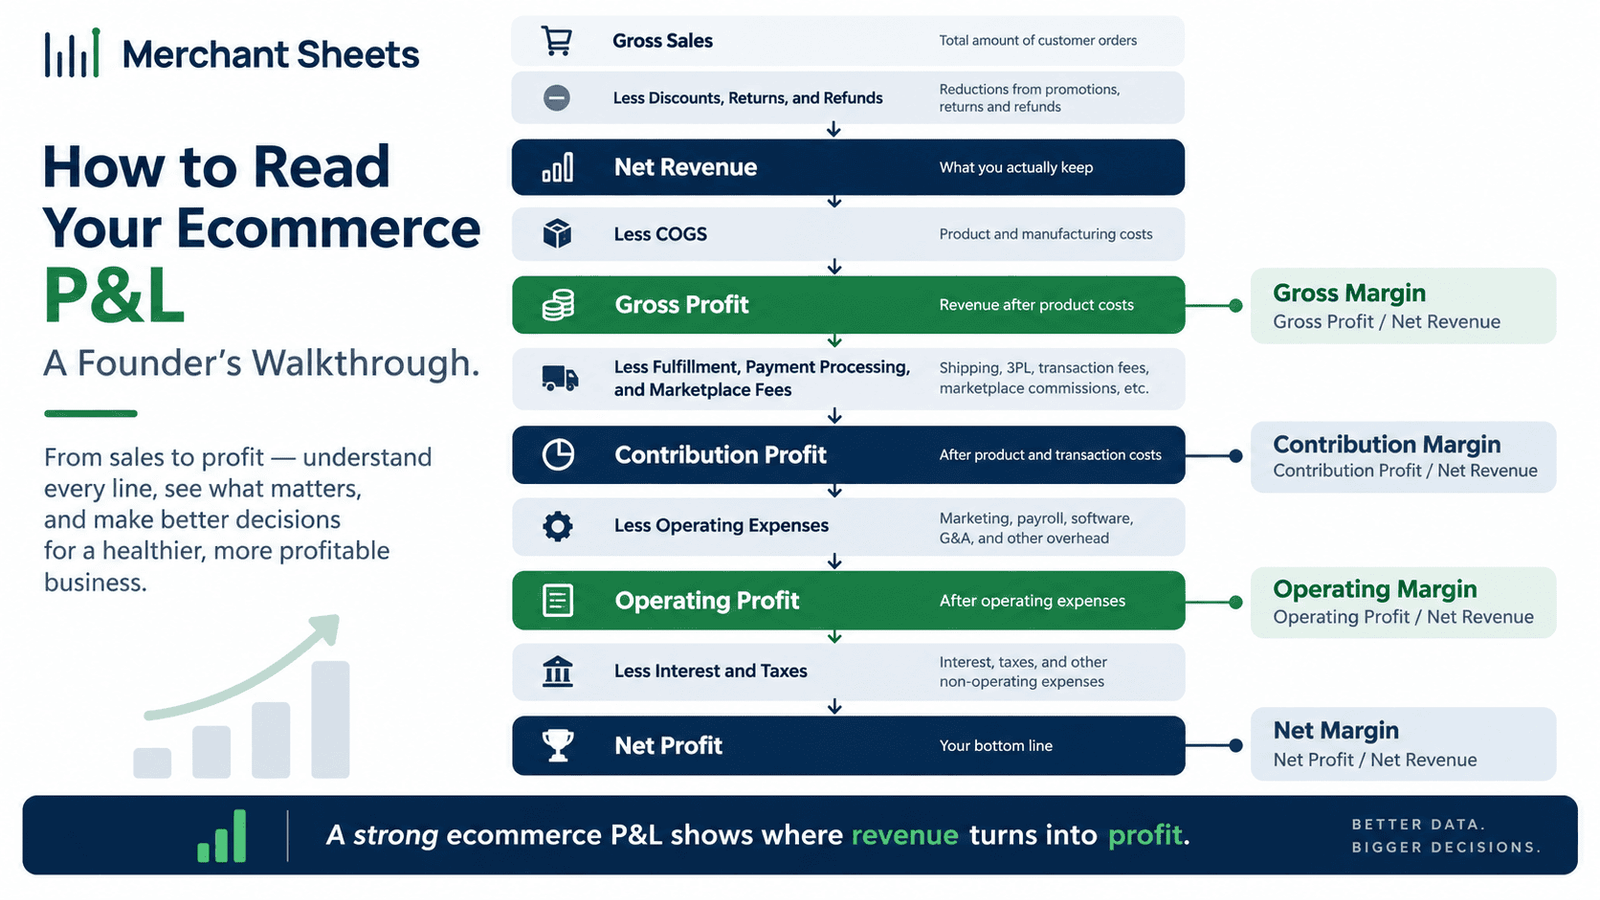
Here’s a monthly P&L for a mid-sized ecommerce brand, laid out the way online selling works. It runs in the same order as any income statement, revenue down to net profit, but it separates the margins an operator manages day to day: gross, contribution, and operating.
A traditional P&L rolls every cost below gross profit into one operating-expenses block. The ecommerce version pulls the variable selling costs and advertising up to their own line, so you can see contribution margin, the profit a single sale leaves after the cost to fulfill and acquire it.
A couple of terms to fix as we go. Contra-revenue is an amount that reduces sales, like a discount or a refund, rather than a cost you spend. Cost of goods sold (COGS) is the direct cost of the goods you sold. The dollars matter, and the percent-of-revenue column on the right is how you’ll read it.
Table 1. An example monthly ecommerce P&L (illustrative numbers; percentages are of net revenue).
| Line | Amount | % of net revenue |
| Gross product sales | $210,000 | 111% |
| Less: discounts & promotions (contra) | ($12,000) | (6%) |
| Less: returns & refunds (contra) | ($8,000) | (4%) |
| Net revenue | $190,000 | 100% |
| Product cost (COGS) | $66,500 | 35% |
| Inbound freight & duty | $5,700 | 3% |
| Gross profit | $117,800 | 62% |
| Referral / marketplace fees | $9,500 | 5% |
| Payment processing fees | $4,750 | 2.5% |
| Fulfillment (FBA + 3PL pick/pack) | $17,100 | 9% |
| Outbound shipping to customer | $9,500 | 5% |
| Contribution margin (before ads) | $76,950 | 40.5% |
| Advertising (the swing line) | $28,500 | 15% |
| Contribution margin (after ads) | $48,450 | 25.5% |
| Salaries & wages | $22,000 | 11.6% |
| Software & subscriptions | $3,800 | 2% |
| Professional fees | $2,500 | 1.3% |
| Rent & other G&A | $3,200 | 1.7% |
| Operating income (EBIT) | $16,950 | 8.9% |
| Add back: depreciation & amortization | $1,900 | 1% |
| EBITDA | $18,850 | 9.9% |
| Less: interest | ($900) | (0.5%) |
| Net profit (before tax) | $16,050 | 8.4% |
Which four margin layers should you read?
The fastest way to read a P&L is to stop on the four margin layers the lines roll up into, because each one answers a different question and points at a different fix. Gross margin is about the product. Contribution margin is about the sale. Operating income is about the business. Net profit is what’s left for you.
Gross margin, which is revenue minus COGS as a percent of revenue, asks whether the product is priced and sourced to make money before any selling cost. A thin gross margin can’t carry ads and overhead however well you run everything else.
Contribution margin asks whether a sale still profits after the variable cost to fulfill and acquire it, and it’s the number that tells you whether growth helps or hurts. Read the layers from the top down, because a problem high on the statement swamps everything below it, so you fix a weak gross margin before you touch software spend.
Table 2. The four layers, and what each one is telling you.
| Layer | Where it lands (of net revenue) | The question it answers | If it’s thin, look at |
| Gross margin | Gross profit / net revenue | Is the product priced and sourced to make money? | Product cost, freight, pricing, discounting |
| Contribution margin | After variable fees, fulfillment, shipping, and often ads | Does a single sale still profit after fulfillment and acquisition? | Fee stack, fulfillment, shipping, ad efficiency |
| Operating income | After fixed operating expenses | Does the business profit after the cost of running it? | Payroll, software, overhead |
| Net profit | After interest and tax | What’s left for the owner or to reinvest? | Debt cost, tax, and every layer above |
Five P&L lines that behave differently in ecommerce
A handful of lines behave differently on an ecommerce P&L than on a generic income statement, and reading them the generic way throws off every number underneath.
- Gross vs net revenue: Gross sales is what customers were charged, while net revenue is what’s left after discounts, refunds, and returns, which are contra-revenue rather than expenses. Read gross sales as revenue and every margin below looks better than it is.
- Variable fees vs the fixed plan: Per-order fees like referral, fulfillment, and payment processing belong in cost of goods sold because they move with each sale, while the fixed platform plan you pay regardless is an operating expense. Where each one sits is defined by your chart of accounts.
- Advertising, the swing line: A traditional P&L parks ad spend in operating expenses, while many operators pull it above the contribution line to judge each sale after acquisition cost. The placement is a choice, so know which one your statement uses.
- Sales tax: The tax you collect is money you owe the state, a pass-through liability, so it shouldn’t appear on the P&L as income at all.
- Unsold inventory: Stock you’ve bought but not sold is an asset on the balance sheet, and it becomes a cost as COGS only when it sells. That’s why a big purchase order doesn’t dent this month’s profit.
Why read your P&L as percentages and trends?
Read every line as a percent of net revenue, then read those percentages across months and against the same month last year. A single month’s dollar figure can’t tell you whether a number is healthy or moving the wrong way. A $28,500 ad bill means little on its own; 15% of revenue, up from 11% two months ago, is a story.
There are two reads on the same statement. Reading down it, each line as a percent of revenue, which is called common-size, lets you benchmark a line and spot the one out of range.
Reading across time, this month against recent months and the same month last year, catches drift and separates a real change from seasonality. Ecommerce is seasonal, so the same-month-last-year comparison is often the honest one.
One caution: an accrual P&L can look lumpy when a cost and the revenue it earned land in different months, which is a timing artifact rather than a loss, and the difference is worth understanding through cash vs accrual accounting.
The ranges below help calibrate a read; net profit for ecommerce tends to land in the high single digits to mid teens, with fuller figures in average ecommerce profit margins.
Table 3. Rough percent-of-revenue ranges to calibrate a read (illustrative; varies by category, verify your own).
| Line | Typical range (% of net revenue) | Read it as |
| Gross margin | 55% to 70% for many DTC brands | Below about 50% leaves little to carry ads and overhead |
| Total variable selling cost | 15% to 30% | Fees, fulfillment, and shipping; creeps as the channel mix shifts |
| Advertising | 10% to 25% | The lever most in your control month to month |
| Operating expenses (fixed) | 15% to 30% | Should fall as a percent as revenue grows |
| Net profit margin | High single digits to mid teens | Where the whole statement nets out |
The blended-number trap: read the P&L by channel and SKU
A single company-wide P&L can hide a losing channel or product, because it blends winners and losers into one average. A healthy overall margin can sit on top of a SKU that loses money on every order, or a channel that only looks fine because a strong one is carrying it.
Reading the blended statement is where you start, and it isn’t where decisions get made.
Two cuts fix it. By channel, the same P&L split into DTC and Amazon columns shows how a marketplace’s referral and fulfillment fees can turn a product that’s healthy on your own site into a thin or negative one there, which is the work of multi-channel ecommerce accounting.
By SKU, the layered read applied per product tells you which items earn their shelf space and which grow revenue while shrinking profit. This is the level most operators never see, because their software shows one blended statement, and it’s where the read you’ve learned pays off.
Your 5-minute monthly P&L read
Once your monthly bookkeeping is closed for the period, you can read the P&L in about five minutes by going in a fixed order and reading layers and percentages instead of lines. Work through these steps.
- Start at net revenue, the figure left after discounts, refunds, and returns, and read from there rather than gross sales.
- Read the four layers from the top down: gross margin, contribution margin, operating income, and net profit, each as a percent of revenue.
- Compare each layer to last month and to the same month last year, and flag any that moved more than a point or two.
- Trace a moved layer to its line: a gross-margin dip points at product cost, freight, or discounting, while a contribution dip points at fees, fulfillment, shipping, or ad efficiency.
- Check placement: variable fees in COGS, the fixed platform plan in operating expenses, no sales tax on the statement, and this month’s inventory buys not showing as cost.
- If the blended margin looks fine, cut it by channel and SKU before you trust it, so a losing segment can’t hide inside the average.
Frequently asked questions
What's the difference between a P&L and an income statement?
There’s none; they’re two names for the same report, which shows revenue, costs, and the resulting profit or loss over a period, and you’ll see both terms used interchangeably.
What's a good net profit margin for an ecommerce business?
It varies widely by category and stage, but many established ecommerce brands land in the high single digits to mid teens as a percent of revenue, so benchmark yours against your own category rather than a single headline number.
Why doesn't my inventory purchase show up on my P&L?
Inventory you’ve bought but not sold is an asset on the balance sheet rather than a cost, and it only moves onto the P&L as cost of goods sold when the product sells, so a big purchase order doesn’t reduce this month’s profit.
Should advertising go in COGS or operating expenses?
Advertising is traditionally an operating expense, though many operators pull it above the contribution-margin line to judge each sale after the cost to acquire it, and either placement is valid as long as you know which one your P&L uses.
Is the sales tax I collect part of my revenue?
No; sales tax you collect is money you owe the tax authority, a pass-through liability, so it shouldn’t appear as revenue on your P&L at all.
Why does my profit look fine but my bank account is empty?
A P&L reports profit on an accrual basis and ignores timing, so cash can be tied up in inventory or held as a marketplace reserve even in a profitable month, which is why you also read the cash flow statement.
How often should I read my P&L?
Monthly, once the books are closed, reading layers and percentages against prior months and the same month last year, since a quarterly-only read is too slow to catch a margin drifting the wrong way.
Can I read one P&L for my whole business, or do I need it by channel?
Read the blended P&L first, then split it by channel and SKU, because one company-wide statement can hide a channel or product that loses money inside a healthy-looking average.
