
Key takeaways
- Inventory aging tracks how long each SKU has sat unsold, usually in day buckets like 0–30, 31–60, 61–90, and 90-plus, so slow movers surface early.
- Dead stock has no realistic demand at its current price; slow-moving stock still sells below plan and can often be rescued with a markdown or a bundle.
- Judge “dead” against a SKU’s own velocity, not a flat 180 days: a fast turner stuck at 90 days is a problem, while a slow seasonal SKU at 120 may be fine.
- Aged stock costs roughly 20% to 30% of its value a year to hold, in storage, tied-up capital, and obsolescence, and it drags GMROI toward zero.
- Work the buckets: freshen and freeze reorders early, mark down or bundle in the middle, and liquidate or write down at net realizable value once it’s dead.
Every unsold unit is cash sitting on a shelf, aging quietly until it’s worth less than you paid for it. Inventory aging is how you catch it: a per-SKU view of how long stock has sat, so you can act on the slow movers before they harden into dead stock you can only write off.
This guide shows you how to build the aging report, tell a slow mover from a dead one, price what the aging is costing you, and clear it before it sinks more cash.
What is inventory aging?
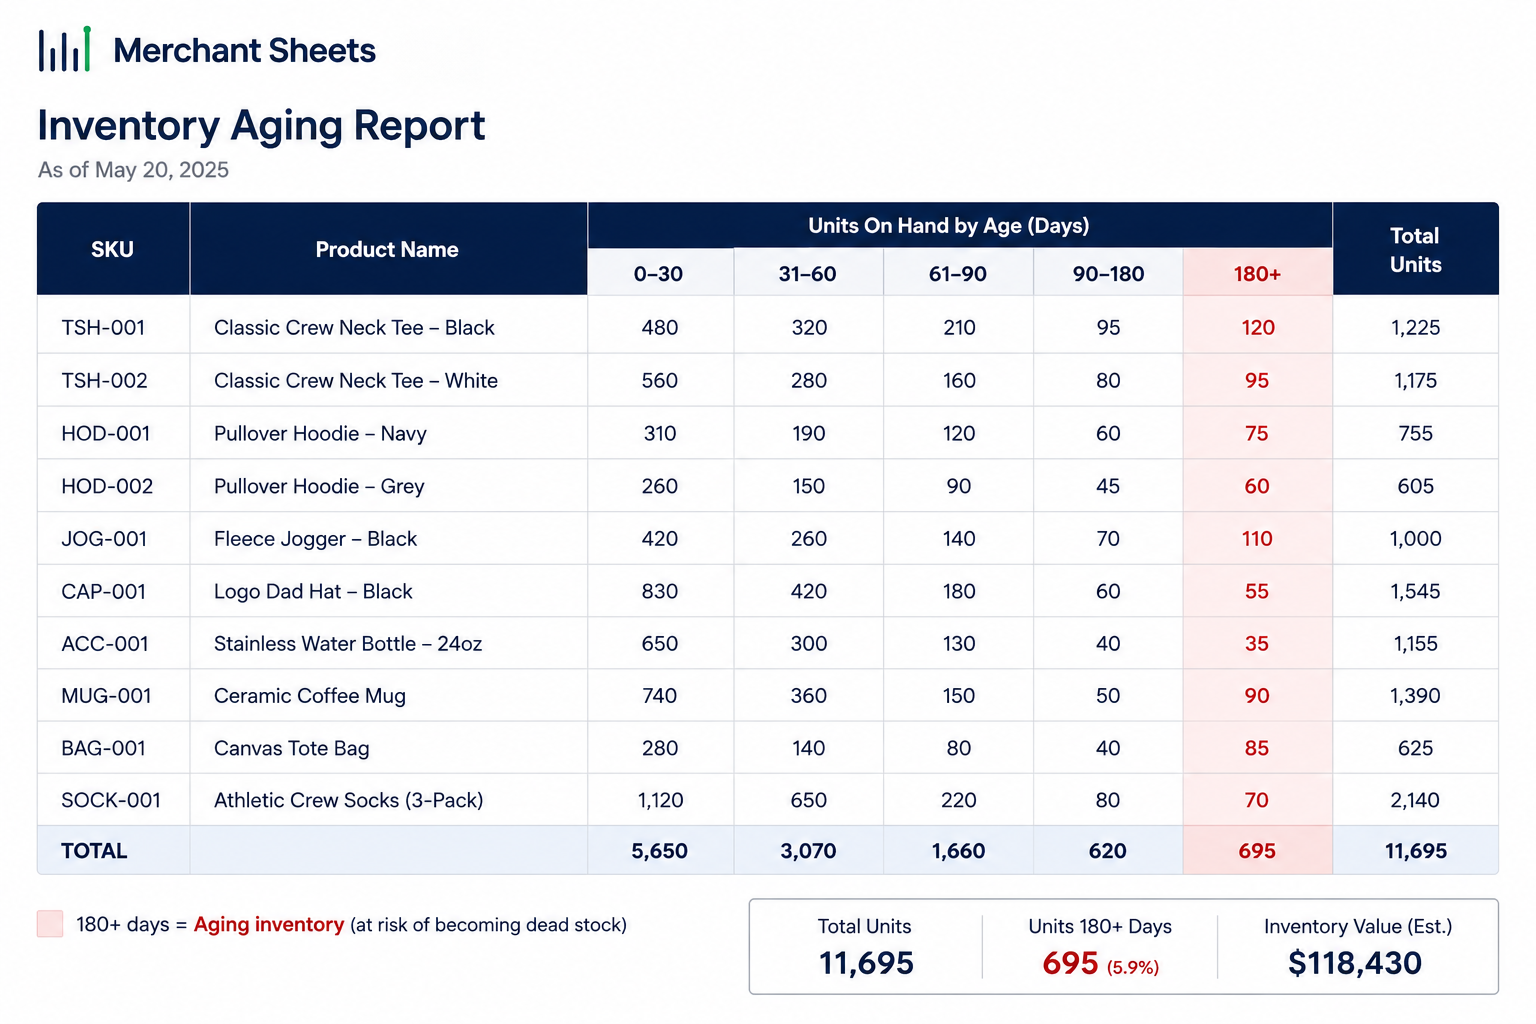
Inventory aging is how long your stock has sat unsold, tracked one SKU at a time and sorted into day buckets like 0–30, 31–60, 61–90, and 90-plus. An inventory aging report lays those buckets across your catalog, showing units on hand and their age, so you can see which products are moving and which are quietly turning into dead weight.
Here’s the distinction that decides whether the report is useful: aging lives at the SKU level, not the catalog level. Most guides stop at a single blended average inventory age, which is your days inventory on hand dressed up. That one number hides dead stock, because a pile of 200-day SKUs averages against your fast sellers and disappears. The per-SKU report is what puts the aged units back on the page.
Aging is one gauge in a wider inventory planning framework, and it’s the one that catches money already committed.
Aged, slow-moving, or dead: what’s the difference?
The three terms get used interchangeably, but the exit depends on which one you’re holding:
- Aged inventory: The umbrella term for stock that’s sat longer than it should for its velocity. It’s a warning, not a verdict.
- Slow-moving stock: Still sells, but below plan. There’s demand left, so a markdown or a bundle can usually rescue the margin.
- Dead (obsolete) stock: No realistic demand at its current price, because it’s discontinued, out of season, or replaced. The job shifts from protecting margin to recovering cash.
How do you calculate inventory age?
There are two levels, and you want both. Per SKU, age is today’s date minus the date the units arrived (or the date of their last sale, if you’d rather track movement): one row per SKU, one age each. That’s the number the aging report is built from.
At the catalog level, the blended figure is the average inventory age, and it equals your days inventory on hand:
| Average inventory age = (average inventory ÷ COGS) × 365 |
For a brand carrying $225,000 in average inventory against $900,000 in annual COGS, that’s (225,000 ÷ 900,000) × 365, or about 91 days. As a rough read, a blended average of 60 to 90 days is healthy for most catalogs, and stock is often called dead once it passes 180 days (as of mid-2026).
Treat those as starting points, not rules, and adjust per SKU against its own inventory turnover: a product that normally turns twelve times a year is in trouble at 90 days, while a slow seasonal line might sit that long by design.
Pick one date convention, received or last-sold, and hold it across the catalog so the numbers stay comparable.
How to build an inventory aging report by SKU
Export your on-hand inventory with a date and a unit count for each SKU, then add three columns. First, age: subtract the received date from today with a simple date formula (or =DATEDIF).
Second, the bucket: drop each SKU into a band with an IF or =COUNTIFS formula.
Third, value: multiply units on hand by unit cost, so you can see where the cash sits, not only where the units sit. The same date math and bucketing work identically in Excel and Google Sheets.
A snapshot for a handful of SKUs makes the payoff obvious:
| SKU | Days on hand | Bucket | Units on hand | Value at cost |
| A (best seller) | 22 | 0–30 fresh | 400 | $6,000 |
| B (mid variant) | 74 | 31–90 slow | 250 | $5,000 |
| C (discontinued color) | 210 | 180+ dead | 180 | $9,000 |
| D (seasonal carryover) | 130 | 90–180 aging | 90 | $3,600 |
SKU C is the one to act on now. Nine thousand dollars in cost sitting 210 days would vanish into a blended average, but on the per-SKU report it’s the obvious problem, and its value column tells you exactly how much cash is trapped there.
What aged stock costs you
Holding aged stock isn’t free, and the bill runs whether or not the units ever sell. Carrying cost, the yearly cost of holding inventory, typically lands around 20% to 30% of the stock’s value, covering storage, insurance, shrink, obsolescence, and the capital tied up in units you’ve already paid for.
That capital is the quiet one: it’s cash tied up in inventory that you can’t put toward the next purchase order, ads, or payroll.
Run it on SKU C. That $9,000 of dead stock at a 25% carrying cost bleeds about $2,250 a year, on top of freezing the $9,000 itself. It also drags your GMROI down, because the gross margin you earn on a unit that never turns approaches zero, and a catalog full of aged SKUs pulls the whole ratio with it.
Aged stock is one of the few problems that gets more expensive the longer you look away from it.
How do you clear dead and aging stock?
The right move depends on the bucket, and the rule is to escalate as the stock ages: light touches early, deeper cuts later. Match each band to its play:
Table: what to do at each age bucket
| Age (days on hand) | What it means | What to do |
| 0–30 | Fresh; still selling | Protect visibility, bundle or cross-sell, freeze reorders if it’s slowing |
| 31–90 | Slow-moving; below plan | Planned markdown, bundle with a top seller, try a secondary channel |
| 90–180 | Aging toward dead | Deeper markdown or clearance, wholesale or outlet, stop all reorders |
| 180+ | Likely dead stock | Liquidate, donate, or write down to net realizable value |
The math behind every one of these is the same: cash you recover on a markdown beats units that never sell, so run the ROI on a markdown and take the discount that clears the shelf.
Once a SKU is genuinely dead, writing it down to net realizable value books a loss you’ve already taken and frees the space and the mental overhead; how you record that write-down is a question for your bookkeeper or accountant.
Better still is not getting there, and most aging traces back to over-ordering, so tighter demand forecasting is the upstream fix that keeps the report short.
Catch aging stock before it turns into dead stock
Spotting one dead SKU is easy; catching every one across a growing catalog, month after month, is the part that slips.
The Merchant Sheets Inventory Management Base tracks each SKU’s age, turnover, and days on hand, flags the items crossing into dead-stock territory, and shows the cash tied up in each one. It turns the aging report from a thing you rebuild by hand into a live view, so you act on a slow mover while a markdown still recovers something instead of finding it at 200 days.
Frequently asked questions
What is inventory aging?
Inventory aging is a measure of how long each SKU has sat in stock unsold, usually grouped into day buckets like 0–30, 31–60, 61–90, and 90-plus. An inventory aging report shows those buckets across your catalog so you can spot slow-moving and dead stock early, before it ties up cash you can’t recover.
What is a good inventory age?
A blended average inventory age of 60 to 90 days is healthy for most catalogs, though the right target depends on your products’ velocity. Fast-turning SKUs should clear far quicker, while slow seasonal lines can sit longer by design, so read each SKU against its own inventory turnover rather than one universal number.
When does inventory become dead stock?
Inventory is usually called dead once it passes about 180 days with little or no movement, but the honest test is demand, not the calendar: stock is dead when there’s no realistic demand at its current price. A fast-turning SKU can be effectively dead at 90 days, while a seasonal item may still be waiting for its season.
What's the difference between slow-moving and dead stock?
Slow-moving stock still sells, but below plan, so there’s demand left to work with and a markdown or bundle can often rescue the margin. Dead stock has no realistic demand at its current price because it’s discontinued, out of season, or replaced, so the goal shifts from protecting margin to recovering whatever cash you can.
How do you get rid of dead stock?
Escalate by how long it’s sat: bundle or improve the listing early, mark it down or move it to a secondary channel in the middle, and liquidate, donate, or write it down to net realizable value once it’s truly dead. The aim at the dead-stock stage is to convert shelf space back into cash, even at a loss.
How do you calculate inventory age?
Per SKU, subtract the received date (or last-sold date) from today’s date to get each item’s age in days. For a catalog-level figure, use average inventory age = (average inventory ÷ COGS) × 365, which is the same as your days inventory on hand and gives you one blended number to track over time.
