
Key takeaways
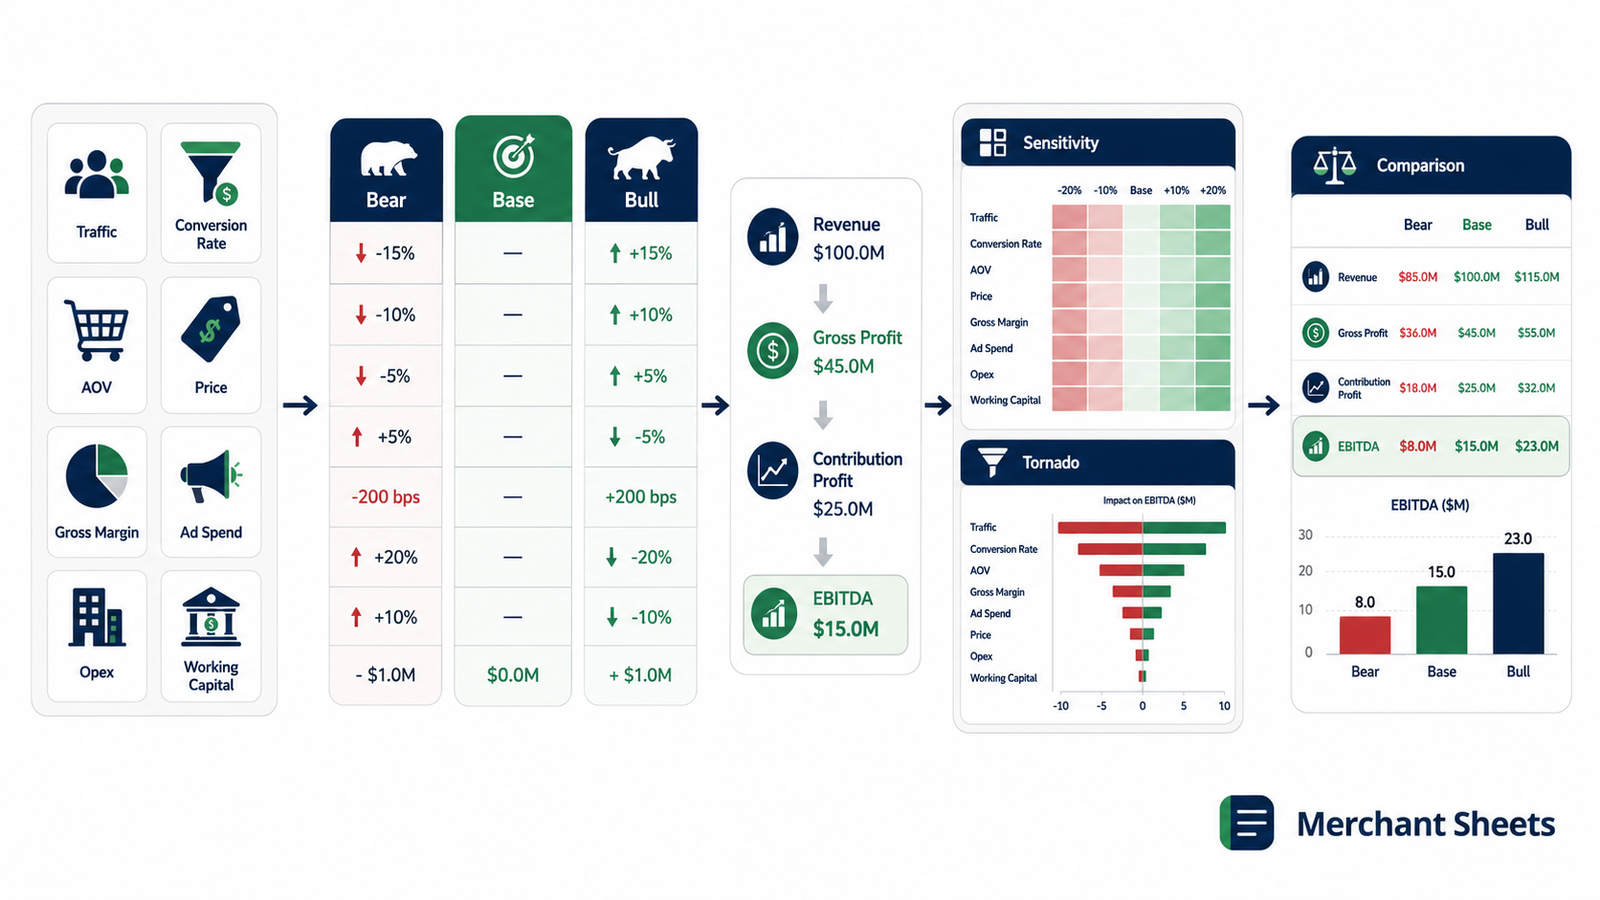
- Scenario planning models the same business under three sets of assumptions — Bear (worst), Base (expected), and Bull (best) — to show the range of outcomes instead of a single guess.
- Build it on a handful of drivers, not hundreds of line items: new customers, repeat rate, average order value, gross margin, acquisition cost, marketing, fulfillment, and fixed opex carry the whole P&L.
- Keep every case plausible. A worst case you couldn’t survive and a best case you couldn’t reach are both useless for planning.
- The payoff is a ranked list of levers. A tornado view sorts the eight drivers by how far each swings EBITDA, so you defend or push the two or three that matter and stop fussing over the rest.
- In our worked example, a base case at 7% EBITDA margin becomes a 44% loss when every driver turns against you at once — which is exactly why you model the downside before you need it.
Scenario planning takes your one forecast and splits it into three: a base case you expect, a worst case you can survive, and a best case you can chase. It answers the question a single forecast can’t — what happens to profit if the year goes sideways, and what happens if it breaks your way.
Built right, it hands you more than three numbers. It tells you which lever moves the outcome most, so you know where to spend your attention when the plan meets reality.
This guide walks through the model the way we build ours — eight drivers, three cases each, then the sensitivity tables and the ranking that show which assumption carries your year.
What is scenario planning?
Scenario planning is the practice of running your financial model under several sets of assumptions to see how the outcome changes. In ecommerce, that usually means three cases — a realistic base, a pessimistic worst case, and an optimistic best case — built from the same drivers so the results are comparable. The broader term for the exercise is scenario analysis.
A single forecast gives you one number and a false sense of precision. Scenario planning gives you a range, plus the reasoning behind each end of it. It sits one level above a budget: a budget is the set of targets you commit to for the year, while scenarios are the machine that shows what those targets become if customers, costs, or cash behave differently than planned.
Done well, the exercise changes how you make decisions. Instead of asking “will we hit plan?” you ask “if we miss, how badly, and which assumption is doing the damage?” That’s a more useful question, and it’s the one a good scenario model answers on one screen.
Base, best, and worst case: what each one is for
Each case is a named set of driver values, and each earns its place by doing a different job. We label them Bear, Base, and Bull — borrowed from the way markets describe pessimism and optimism — so the three are quick to talk about in a board or lender conversation.
Table 1 — What each scenario is for.
| Case | What it assumes | What it’s for |
| Base | Current trends hold: steady growth, stable margins and costs | Your planning case and the number you steer by |
| Worst (Bear) | A plausible bad run: acquisition costs climb, margins compress, orders soften | Testing whether you’d survive it — and how much cash you’d need to |
| Best (Bull) | A plausible good run: repeat rate rises, average order value grows, costs ease | Sizing the upside so you’re ready to fund it |
The discipline is in the word plausible. The worst case is the bad-but-real year you’d hit if two or three things go wrong together — soft demand, a pricier ad market, a margin squeeze. The best case is the year your bets land: a stronger repeat rate, a higher average order value, easing costs.
Keep both inside the range your business could realistically reach, or the exercise turns into wishful arithmetic.
Many operators add a fourth, custom case for a specific what-if — a price increase, a new channel, a funding round. Keep it separate from the three anchors so the board view stays clean.
How do you build a scenario model?
You build it on drivers. A driver is a fundamental input the whole model responds to, and a store’s entire P&L rides on about eight of them. Get those right and every other number is a formula. The one rule that keeps scenarios honest: you flex drivers, never formulas.
Change an assumption and let the math recompute; the moment you start editing the results by hand, the cases stop being comparable.
Here’s the full build, in the order you’d construct it:
- Set your inputs: Fix the planning year, the currency, and the EBITDA margin thresholds that flag a scenario as healthy or unhealthy.
- Define your eight drivers: New customers per month, orders per customer per year, average order value, gross margin, acquisition cost, other marketing, fulfillment per order, and monthly opex.
- Set Bear, Base, and Bull for each: Give every driver a pessimistic, a planning, and an optimistic value grounded in your own numbers.
- Name your scenarios: Assemble the driver sets into Bear, Base, Bull, and an optional custom case.
- Read the P&L cascade: Pick an active scenario and follow the drivers down to revenue, gross profit, and EBITDA.
- Run the sensitivity tables: Flex one driver at a time around Base to see how far each moves the outcome.
- Rank the levers with a tornado: Sort all eight drivers by the size of their impact on EBITDA.
- Compare and check: Put the cases side by side and run the integrity checks that prove the model holds.
Set Bear, Base, and Bull for each driver
This step is where scenario planning earns its keep or falls apart. For each of the eight drivers you set three values: one pessimistic, one you’d plan around, and one optimistic.
Pull them from your own history and your category benchmarks rather than round-number guesses. If your average order value (AOV) has ranged from $58 to $72 over the past year, those are your Bear and Bull; a made-up $100 helps no one.
Table 2 — Three drivers across the three cases (illustrative).
| Driver | Bear | Base | Bull |
| Average order value | $58 | $65 | $72 |
| Gross margin | 60% | 64% | 67% |
| Customer acquisition cost | $26 | $20 | $16 |
Notice the acquisition cost runs the other way: a higher customer acquisition cost (CAC) is worse, so the Bear value is the high one. Keeping that ordering straight is part of what the model’s checks verify later. Once the three values are set for all eight drivers, the model can build any case on demand.
Read the P&L cascade to EBITDA
Pick an active scenario and the model runs a single cascade from the drivers down to profit. It’s the same arithmetic in every case, which is what makes the three comparable. Start at the top with volume:
Annual orders = new customers × 12 × orders per customer
Annual revenue = annual orders × average order value
From revenue, gross margin gives you gross profit. Then three cost blocks come off: marketing (acquisition cost times new customers, plus other marketing as a percent of revenue), fulfillment per order, and fixed monthly opex.
What’s left is EBITDA — earnings before interest, taxes, depreciation, and amortization, the profit the operating business throws off before financing and accounting effects.
EBITDA = gross profit − marketing − fulfillment − operating costs
Two unit-economics numbers fall out of the same drivers: contribution per order (what one order clears after its own variable costs) and CAC payback (how many months a new customer takes to repay the cost of acquiring them).
Both sit alongside EBITDA margin among the KPIs you’re flexing, so a scenario’s health reads at a glance rather than needing a separate analysis.
What is sensitivity analysis, and how do you run it?
Sensitivity analysis measures how much the outcome moves when you change one input at a time. You hold every driver at its Base value except one, flex that single driver across a range — say minus 30% to plus 30% — and watch EBITDA respond. It answers “how much does this one thing matter?” where scenario analysis answers “what if several things move together?”
In the sheet, each driver gets a one-variable table: seven steps from minus 30% to plus 30%, with EBITDA recomputed at every step. Each cell rebuilds the full profit formula with only that one driver changed:
Sensitivity cell = EBITDA with every driver at Base, except the one being flexed
Two-variable grids go a step further, flexing a pair of drivers at once — average order value against acquisition cost, or gross margin against customer volume — to expose where two levers compound. Color-coding the cells green, amber, and red against your healthy and watch thresholds turns the grid into a heat map you can read in a second. This is what “what-if analysis” means in practice: a table that puts a real number on each hypothetical.
Which lever matters most? Rank them with a tornado
A tornado chart ranks your drivers by how far each one swings the outcome. For every driver, the model computes EBITDA at its Bear value and at its Bull value, holds everything else at Base, and measures the gap. Sort those gaps widest-to-narrowest and you get a chart shaped like a funnel — the widest bar on top is the lever that moves your year the most.
Here’s the ranking for our worked example, from the driver that swings EBITDA most to the one that swings it least:
Table 3 — Drivers ranked by EBITDA swing from Bear to Bull (Base = $109,000 EBITDA).
| Driver | EBITDA swing, Bear → Bull |
| New customers per month | $310,000 |
| Orders per customer per year | $227,000 |
| Average order value | $192,000 |
| Customer acquisition cost | $120,000 |
| Gross margin | $109,000 |
| Monthly opex | $96,000 |
The pattern is typical: the volume and pricing drivers — how many customers you win, how often they buy, and what they spend — move EBITDA far more than trimming fulfillment or opex. That’s the insight a table of three scenarios hides and a tornado surfaces.
| The payoff: Scenario planning’s real output is a ranked list of levers. The tornado tells you which driver moves EBITDA most, so you put your energy into the two or three that decide the year and leave the small ones alone. |
Compare the scenarios and prove the model holds
The board-meeting view puts all three cases side by side, revenue down to EBITDA, so the range is visible at a glance. Here’s our worked example across the three cases:
Table 4 — The three scenarios side by side (illustrative annual figures).
| Line | Bear | Base | Bull |
| Revenue | $828,000 | $1,560,000 | $2,583,000 |
| Gross profit | $497,000 | $998,000 | $1,731,000 |
| Marketing | $293,000 | $349,000 | $405,000 |
| Fulfillment | $93,000 | $132,000 | $179,000 |
| Operating expenses | $480,000 | $408,000 | $384,000 |
| EBITDA | −$369,000 | $109,000 | $763,000 |
| EBITDA margin | −44.5% | 7.0% | 29.5% |
| Status | Unhealthy | Watch | Healthy |
The spread is the point. A 7% base flips to a 44% loss when every driver turns against you at once, and climbs near 30% when they break your way.
That downside looks severe because it stacks all eight drivers at their worst in the same year — unlikely, but the number you want to have seen before a lender asks for it.
Before you trust any of it, run the integrity checks that separate a real model from a pretty one. Each Base value should be positive, the repeat rate should sit at or above 1.0, gross margin should land between 0% and 100%, and acquisition cost should be ordered Bear ≥ Base ≥ Bull.
If any check fails, a driver was entered wrong and the scenarios are quietly lying.
How do you use scenarios once they’re built?
You drive them, the same way you’d drive any model. The value comes from returning to the three cases as the year unfolds and letting them steer the next decision, rather than building them once and filing them away.
- Set your Base from the plan: Pull the base-case drivers straight from the assumptions you used to build a financial model, so your scenarios and your forecast agree.
- Reforecast as reality lands: Update the drivers when real numbers come in and reforecast against actuals, so the case you’re steering by reflects what you now know.
- Act on the tornado: Fund and defend the top two or three levers first; they’re where a point of improvement pays for itself fastest.
- Rehearse the downside: Keep the worst case current so a bad quarter triggers a plan you’ve already written instead of a scramble.
Skip the setup and start planning
Wiring eight drivers, three cases, a sensitivity grid, and a tornado ranking into a blank sheet is a weekend of formula plumbing, and the lever-ranking logic is where most home-built versions break.
The Scenario Planner template has the drivers, the P&L cascade, the sensitivity tables, and the tornado already wired together and checked — set your Bear, Base, and Bull values and read the range. Get the template and model your next year in an afternoon.
Frequently asked questions
What’s the difference between base case, best case, and worst case?
The base case is your realistic planning scenario, the best case is a plausible upside where your key assumptions land in your favor, and the worst case is a plausible downside where they move against you. All three use the same model and drivers, so the only thing that changes is the input values — which keeps the outcomes directly comparable.
How many scenarios should I model?
Three is the standard set — base, best, and worst — and it’s enough for most planning and board conversations. Add a fourth custom case only when you’re testing a specific decision, like a price change or a funding round, and resist going further; more than four scenarios usually adds noise rather than clarity.
What’s the difference between scenario analysis and sensitivity analysis?
Scenario analysis changes several drivers together to model a complete situation, like a downturn, while sensitivity analysis changes one driver at a time to measure how much that single input matters. You use them together: sensitivity tables show you which levers are powerful, and scenarios combine those levers into stories you can plan around.
Should I build scenario planning in Excel or Google Sheets?
Either works, and a well-built scenario model runs the same in both. Excel handles large files and heavy data tables a little faster, while Google Sheets makes sharing and live collaboration easier. Build it formula-only so it behaves identically wherever you open it, and choose based on where your team already works.
