
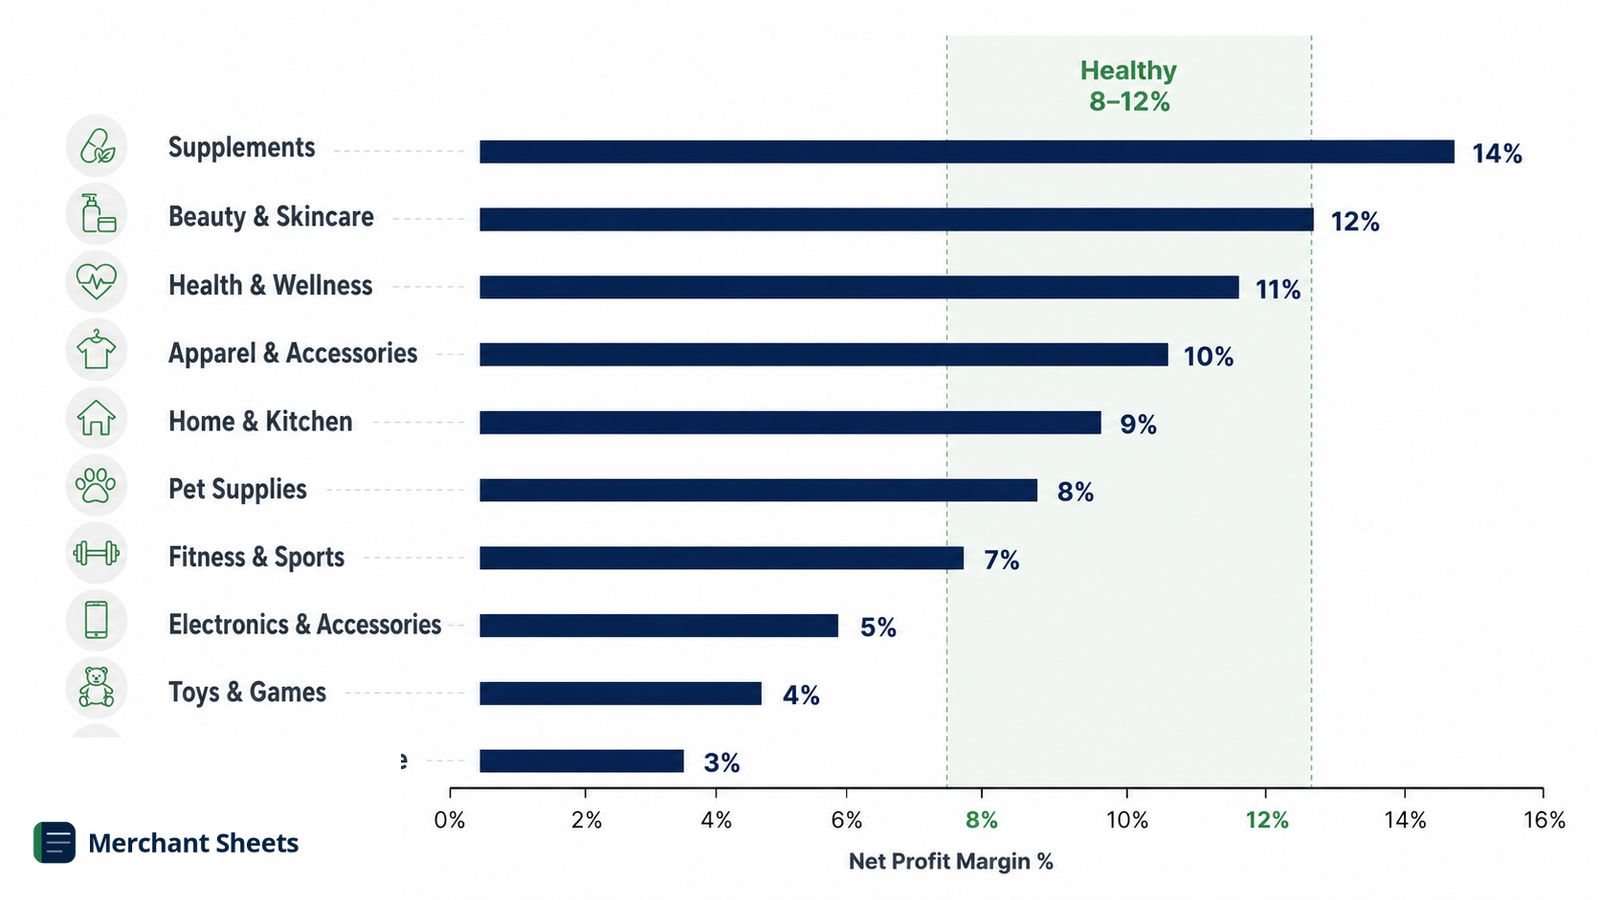
Key takeaways
- A healthy ecommerce net profit margin runs 8–12%; 10% is strong and 15% or more is exceptional, while the blended DTC median often sits nearer 3–5% (as of mid-2026).
- Net profit margin is net profit divided by revenue, the profit left after every cost including COGS, marketing, fulfillment, fees, and overhead.
- Margins swing hard by category: digital products clear 20% or more, while food and electronics often net in the low single digits.
- Published benchmarks disagree because they count different costs, such as the owner’s salary, blended versus new-customer margin, and spend before or after ads, so track your own number on one consistent definition.
- The $10M–$50M “messy middle” is where margins compress hardest, as rising ad and fixed costs outpace revenue.
The average ecommerce profit margin lands around 8–12% net for a healthy store. That single number hides a lot: it moves with your size and your category, and half the benchmarks online disagree because they count different costs. Here’s the honest picture, and what your margin should be once every cost is in.
What’s the average ecommerce profit margin?
A healthy ecommerce net profit margin runs 8–12% of revenue. Anything above 10% is strong, and 15% or more is exceptional for a physical-product store. The blended median across direct-to-consumer brands sits lower, often 3–5%, because acquisition and fulfillment costs eat most of the gross. These ranges are current as of mid-2026.
Net profit margin is what’s left of a sale after every cost comes out: the product itself, marketing, shipping, payment fees, software, payroll, and overhead. As a formula, it’s net profit ÷ revenue. If you want to run the numbers on your own store, here’s how to calculate your margins step by step.
This guide is about the benchmark: what counts as normal once you have the figure.
Average profit margins by vertical
There’s no single normal number, because net margin is driven as much by what you sell and what it costs to acquire a buyer as by how tightly you run the store.
Digital products carry almost no unit cost and light fulfillment, so they keep the most. Beauty and supplements command strong prices but spend heavily to win customers. Food, home goods, and electronics compete on price against thin product margins, so a few points of net is normal and healthy at volume.
Table 1. Typical net profit margin by ecommerce vertical, as of mid-2026. Ranges vary widely by size, sourcing, and how each store counts its costs.
| Ecommerce vertical | Typical net profit margin |
| Digital products | 20–40%+ |
| Beauty & skincare | 8–15% |
| Supplements & health | 8–15% |
| Apparel & fashion | 5–12% |
| Pet | 5–10% |
| Home & furniture | 3–8% |
| Electronics | 3–7% |
| Food & beverage | 2–6% |
| Blended ecommerce / DTC | 5–10% (median often thinner, ~3–5%) |
Read your number against your own vertical and your own trend, not the blended average. A 6% net margin is thin for beauty and strong for grocery.
These are the after-everything figures; for the product-cost picture that sits above them, compare your gross margin benchmarks, and for a deeper cut by brand, see the public-company margin data.
Why published margin numbers disagree
Search for an average and you’ll find 3% in one report and 25% in the next. Both can be right, because they’re not measuring the same thing. The fix is to pick one definition and hold it over time, since your own trend tells you more than any benchmark. Before you compare yourself to anyone, pin down which of these your figure includes:
- Owner’s pay: A founder who doesn’t draw a salary reports a higher margin than the same store paying a market wage for that work.
- Blended vs new-customer: Margin on repeat orders looks far healthier than margin on a first order carrying full acquisition cost.
- Before or after ad spend: Some “profit margin” figures stop at contribution and leave marketing out, which can swing the result by 20 points or more.
- Cash vs accrual: Counting a bulk inventory buy as this month’s cost understates margin now and overstates it later.
- Which margin: Gross, contribution margin, and net are three different lines, and they get quoted interchangeably.
The gross-to-net waterfall: where the money goes
The quickest way to see why net margin lands where it does is to walk one order from the top line down. Start with gross margin, what’s left after the product cost (COGS), then subtract everything it takes to win and ship the sale.
Table 2. Gross-to-net waterfall on a $75 apparel order (illustrative, % of revenue).
| Line | % of revenue |
| Revenue | 100% |
| − COGS | −35% |
| = Gross margin | 65% |
| − Ad spend (acquisition) | −25% |
| − Shipping & returns | −17% |
| − Platform & payment fees | −6% |
| − Overhead & other | −8% |
| = Net margin | ~9% |
That $75 order clears about $6 to $7 in real profit. No single line is outrageous; the point is that they stack. Trim three points off COGS, two off returns, and a few off acquisition, and a 9% store becomes a 15% one.
That’s why the drivers below move the number more than the headline ever will, and why knowing your true COGS is the first place to look.
Profit margin by store size: the “messy middle”
Category isn’t the only thing that moves the number; revenue does too, and not always in the direction you’d expect. Margins tend to follow a curve as a store scales.
Sub-$1M stores often run near break-even, because fixed costs like software, a warehouse, and a first hire land before the volume to cover them. The $1M–$10M band is frequently the sweet spot: enough scale to spread those costs, not yet enough complexity to bloat them.
Then comes the $10M–$50M “messy middle,” where margins compress hardest as media costs climb and headcount, agencies, and tooling grow faster than revenue.
Past $50M, operating leverage tends to pull margins back up, though growth brands often spend the recovery back on acquisition by choice.
Seeing which band you’re in, and where your margin sits inside it, is the kind of thing a KPI Dashboard surfaces at a glance.
Table 3. Typical net profit margin by revenue band, as of mid-2026.
| Annual revenue band | Typical net profit margin | What’s happening |
| Under $1M (startup) | 0–5% | Fixed costs dominate; many run at or below break-even while finding fit |
| $1M–$10M | 8–15% | Often the leanest, most profitable band: scale without heavy overhead |
| $10M–$50M (“messy middle”) | 1–8% | Compression as rising ad and fixed costs outpace revenue |
| $50M+ (scaled) | 5–12% | Operating leverage recovers margin; growth DTC may run thin by choice |
What moves your net margin
Within any category or size band, the stores at the top of the range tend to pull the same levers. These are what move net margin most:
- Pricing power: Brands that can charge a premium, through differentiation or a product buyers can’t easily comparison-shop, protect margin that discounting would erode.
- COGS and landed cost: Every point off your unit cost drops almost straight to the bottom line, so supplier terms, freight, and duty planning pay for themselves.
- Acquisition efficiency: Customer acquisition cost is the single biggest swing factor for most DTC brands, and keeping it in line with lifetime value is what separates a profitable store from a busy one.
- Returns and discount leakage: A high return rate and habitual promo codes quietly bleed several points of margin that never show up in the gross figure.
- Fixed-cost discipline: Software, agencies, and headcount creep up quarter by quarter, and the leanest operators re-earn every fixed cost each year.
When a thin margin is fine, and a fat one isn’t enough
A low net margin isn’t automatically a worse business. A brand growing 60% a year might run a 4% margin on purpose, pouring what would be profit into acquisition and inventory to buy market share while it can. Read alongside growth and cash, that 4% can be a healthier position than a flat store banking 15%.
The reverse holds too. A strong margin on paper doesn’t guarantee money in the bank. A store posting a 20% net margin can still run short on cash when inventory and receivables tie the profit up, which is why operators watch free cash flow next to margin and read net margin as one of several ecommerce KPIs rather than a verdict on its own.
See where your profit margin lands
A benchmark only helps if you can see your own number beside it. The KPI Dashboard tracks net profit margin along with 11 other core metrics across 24 months of actuals, compares each to the target you set, and flags where you stand with status pills, in Excel or Google Sheets.
Paste in your numbers and watch the trend, instead of guessing where you sit.
Frequently asked questions
What is a good net profit margin for an online store?
A good net profit margin for an online store is 8–12%, with 10% considered strong and 15% or more exceptional for a physical-product brand. Newer stores often run lower, in the 2–5% range, while they build volume and bring acquisition costs down. Digital-product stores can clear 20% or more.
Is 10% profit margin good for ecommerce?
Yes, a 10% net profit margin is good for most ecommerce stores. It sits at the top of the healthy 8–12% range and means the business keeps a dime of real profit on every dollar of sales after all costs. For high-cost categories like electronics or food it’s strong; for digital products it’s on the low side.
What’s the difference between gross and net profit margin?
Gross margin is what’s left after the direct cost of the product (COGS), while net margin is what’s left after every cost, including marketing, fulfillment, fees, payroll, and overhead. Net margin usually runs 40 to 55 points below gross. A store can post a 65% gross margin and a 10% net margin in the same period.
Why is my ecommerce profit margin so low?
The most common cause of a thin ecommerce margin is customer acquisition cost eating the gross profit, followed by high returns, heavy discounting, and fixed costs that outgrew revenue. Walking one order from revenue down to net usually shows which line is the culprit, and small cuts across COGS, returns, and ad spend compound quickly.
What is the average profit margin for a Shopify store?
There’s no official Shopify-wide figure, but most established Shopify stores run net profit margins in the same 8–12% range as ecommerce broadly, with newer stores lower and lean, high-margin niches higher. The platform doesn’t change the economics; category, size, and acquisition cost do.
