
Key takeaways
- Across nine public direct-to-consumer (DTC) brands, gross margin runs from about 39% to 70%, with a median near 54% (fiscal 2025 filings, pulled mid-2026).
- Gross margin is (revenue − cost of goods sold) ÷ revenue, the share of each sale left after the product cost and before marketing, fulfillment, and overhead.
- Category sets the level: beauty and premium apparel clear 60–70%, while footwear, mattresses, and household goods run in the high-30s to mid-40s.
- A filed gross margin isn’t comparable to yours until you know what’s in the cost-of-goods line, since some brands load freight and fulfillment into it and others don’t.
- Most of these brands saw gross margin fall in 2025 on tariffs, freight, and heavier promotion, so read the direction of your own margin over the gap to any one brand.
Most DTC gross-margin benchmarks are survey averages with no names attached. This one uses real numbers from public filings. Across brands you already know, gross margin mostly lands between 40% and 70%, set more by category than by how well the store is run.
What’s the average DTC gross margin?
Across public DTC brands, gross margin mostly runs 40–70%, with a median around 54% as of mid-2026. Beauty and premium apparel sit at the top, footwear and mattresses at the bottom, and the level tracks what a product costs to make and ship far more than how the store is run.
Gross margin is the share of a sale left after the product cost, before you spend a dollar on marketing or overhead. As a formula, it’s (revenue − cost of goods sold) ÷ revenue. If you want the mechanics on your own numbers, here’s the gross margin formula step by step.
DTC gross margins from public filings
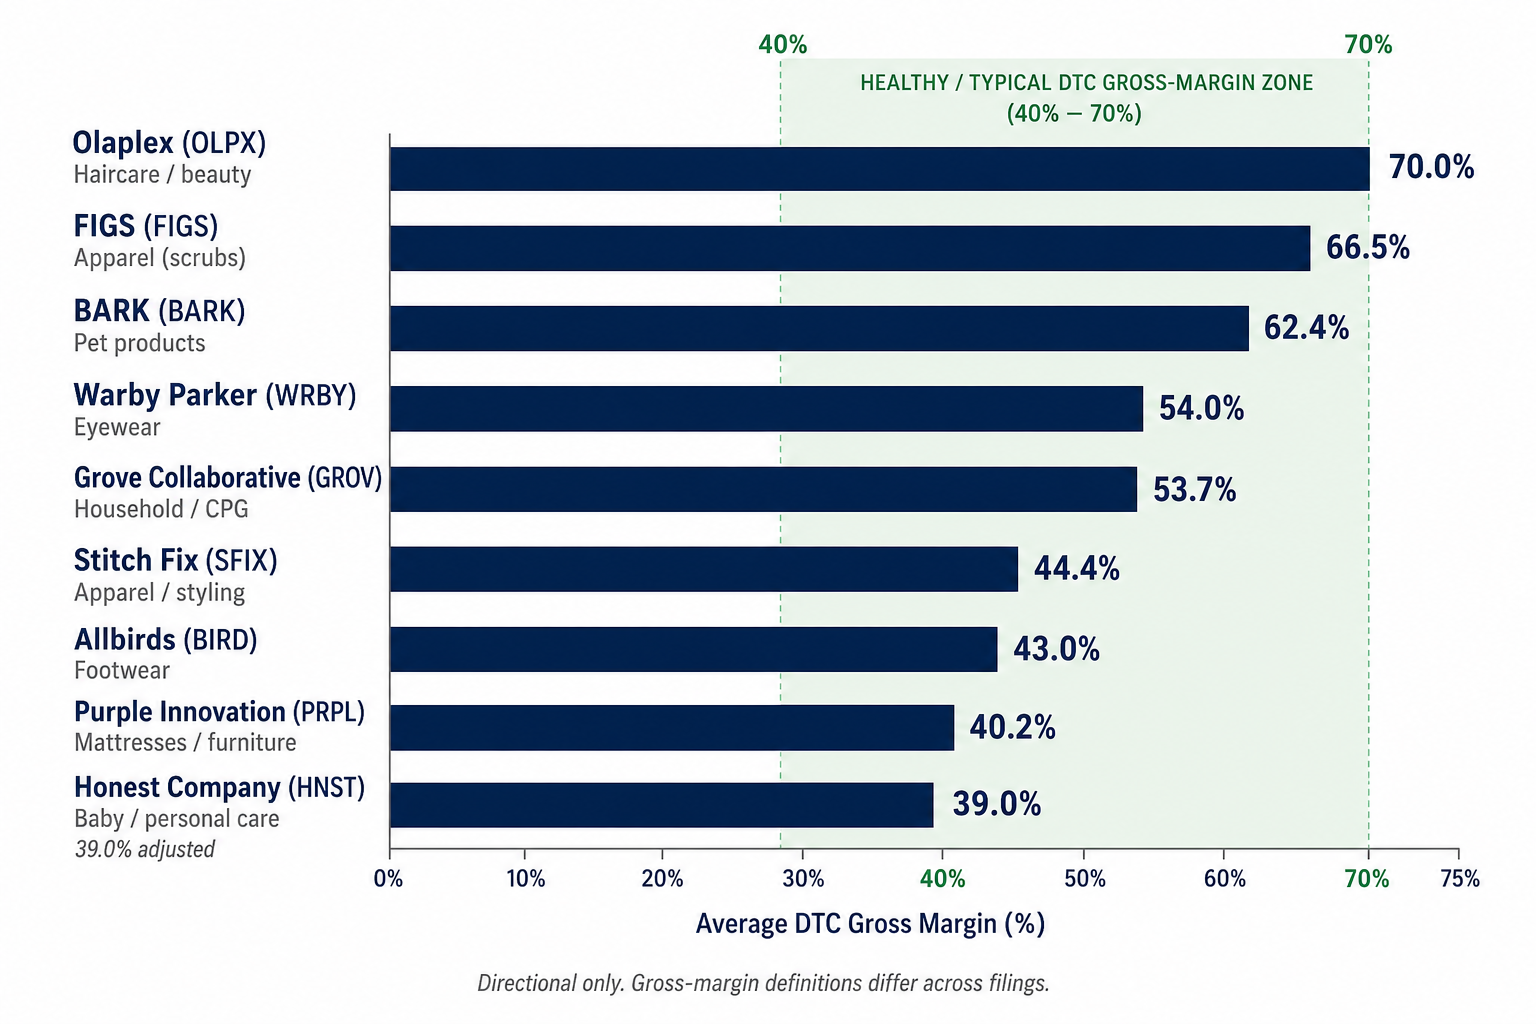
There’s no single normal number, because gross margin is driven by category economics: product cost, return rates, and how much freight sits in the cost line. Here’s where nine recognizable DTC brands landed in their most recent fiscal year.
Table 1. Gross margin by public DTC brand, fiscal 2025 (pulled mid-2026). Cost-of-goods definitions differ across filings, so treat these as directional.
| Brand (ticker) | DTC category | Gross margin (FY2025) |
| Olaplex (OLPX) | Haircare / beauty | ~70% |
| FIGS (FIGS) | Apparel (scrubs) | 66.5% |
| BARK (BARK) | Pet products | 62.4% |
| Warby Parker (WRBY) | Eyewear | 54.0% |
| Grove Collaborative (GROV) | Household / CPG | 53.7% |
| Stitch Fix (SFIX) | Apparel / styling | 44.4% |
| Allbirds (BIRD) | Footwear | ~43% |
| Purple Innovation (PRPL) | Mattresses / furniture | 40.2% |
| Honest Company (HNST) | Baby / personal care | ~39% (adjusted) |
The spread is wide, and it tracks the product more than the operator. Olaplex sells small, high-price haircare with low unit cost, so it clears roughly 70%. FIGS and BARK run in the 60s on branded apparel and consumables. Warby Parker holds 54% partly because it owns its optical lab.
At the bottom, Allbirds, Purple, and Honest sit in the high-30s to low-40s, weighed down by material cost, freight, and heavy fulfillment.
Honest is a special case: its reported figure was distorted by one-time inventory write-downs, so we’ve used its adjusted gross margin, which is the cleaner read.
Roll those brands up by category and you get a quick map for finding your own starting point.
Table 2. Typical DTC gross-margin band by category, as of mid-2026.
| DTC category | Typical gross margin | What sets the level |
| Beauty / haircare | 60–70%+ | Prestige pricing over a low unit cost |
| Apparel | 45–66% | Brand pricing power against return rates |
| Eyewear | ~50–55% | Owned lab and vertical integration |
| Pet | ~60% | Branded consumables and toys |
| Household / CPG | ~50–55% | Consumables mix, mid-range pricing |
| Footwear | ~40–45% | Material and freight cost |
| Mattress / furniture | ~38–42% | High unit cost and heavy freight |
Why the filed number isn’t your Shopify number
Before you hold your margin up against Warby Parker’s, know that public companies don’t all draw the cost-of-goods line in the same place. Cost of goods sold (COGS) is meant to be the direct cost of the product, but filings vary on what else they fold in.
That’s why two brands with the same real economics can report gross margins ten points apart. One buries inbound freight, duties, and warehousing in the cost line; the next parks them below gross profit as operating costs. Before you compare, pin down which of these each figure includes:
- Inbound freight and duties: Getting product to your warehouse can sit in COGS or in operating costs, and tariffs made this line swing hard in 2025.
- Fulfillment and warehousing: Pick, pack, and ship lands inside COGS for some brands and well below gross profit for others.
- Merchant and platform fees: Payment processing is a variable cost of every sale, yet many filings leave it out of the gross figure.
- Returns and reserves: How a company accounts for returned goods and write-downs moves reported gross margin, as Honest’s year showed.
Read these as ceilings for a brand at scale
The brands in that table each do $400M to $900M a year. That scale buys negotiated unit costs, owned manufacturing, and duty-drawback programs a store doing $1M–$5M can’t match yet. Read the public number as the ceiling for a category at scale, and expect to run below it early.
The gap closes with volume and sourcing, not willpower. The fastest lever is your landed cost, the all-in cost to get a unit to your door, since every point you take out of it drops toward the bottom line.
For where your category tends to start, our gross margin benchmarks by vertical give the survey view that sits underneath these named brands, and the ecommerce KPIs that matter put gross margin in context with the rest of the P&L.
What 2025 did to DTC margins
A benchmark is a snapshot, and 2025 moved the whole group down. Tariffs, higher freight, and heavier promotion compressed gross margin across most of these brands, and several posted year-over-year declines even as revenue grew.
FIGS fell to 66.5% from a post-IPO high near 72%. Warby Parker gave back about 130 basis points on tariffs and shipping. Allbirds ran in the low-40s on promotion and duties. The lesson: the direction of your own margin matters more than the gap to a brand that absorbed a tariff hit last quarter.
Watching gross margin next to net profit margin, month over month, tells you more than any one comparison.
See where your gross margin lands
A benchmark only helps if you can see your own number beside it. The KPI Dashboard tracks gross margin along with 11 other core metrics across 24 months of actuals, compares each to the target you set, and flags where you stand with status pills, in Excel or Google Sheets.
Paste in your numbers, put your margin next to the brands you know, and watch the trend instead of guessing.
Frequently asked questions
What is a good gross margin for a DTC brand?
A good gross margin for a DTC brand is 50% or higher, though the healthy level depends on category: beauty and premium apparel often clear 60–70%, while footwear, furniture, and food can be healthy in the 35–45% range. Public DTC brands post a median near 54%, so anything above that is strong for a physical-product store.
What gross margin does Warby Parker or FIGS run?
Warby Parker reported a 54.0% gross margin and FIGS reported 66.5% for fiscal 2025. FIGS runs higher because branded apparel carries strong pricing over a low unit cost, while Warby Parker’s eyewear margin reflects its owned optical lab, offset in 2025 by tariffs and higher shipping.
Why is my gross margin lower than public brands?
Your gross margin is likely lower because large public brands buy at negotiated unit costs, sometimes own manufacturing, and run duty programs that a smaller brand can’t match yet. Definitions also differ: if you count fulfillment and freight in your cost of goods and they don’t, your figure will read several points lower on the same economics.
Do DTC gross margins include shipping?
Sometimes, and that’s the catch. Some brands include inbound freight and fulfillment in cost of goods sold, which lowers reported gross margin, while others record those costs below gross profit as operating expenses. Always check a company’s cost-of-revenue definition before comparing its gross margin to yours.
What’s the difference between gross margin and contribution margin?
Gross margin subtracts only the product cost (COGS), while contribution margin also subtracts the other variable costs of a sale, like shipping, payment fees, and per-order ad spend. Contribution margin is the more honest per-order profit number, and it always sits below gross margin.
