
Key takeaways
- The average ecommerce repeat purchase rate sits around 25–28% on a 12-month window in 2026, ranging from about 10% for furniture and luxury to 45% or more for supplements and coffee.
- Repeat purchase rate is the share of customers who buy again, calculated as repeat customers divided by total customers over a set window; it’s the same metric as repeat customer rate.
- The number tracks purchase cycle more than retention skill, so consumables that reorder naturally sit high and durable goods sit low by design.
- The measurement window moves the figure more than anything else: the same brand can read 12% at 30 days and 45% at 12 months.
- The highest-leverage move is converting one-time buyers to a second purchase, because each repeat order raises the odds of the next.
The average ecommerce repeat purchase rate runs around 25–28%, but that blended number hides a huge spread. A coffee brand reordering monthly can clear 45%, while a furniture brand near 12% is doing fine. Here’s the repeat-rate benchmark by vertical, and the target that fits your category.
What’s the average repeat purchase rate by vertical?
Repeat purchase rate is the share of your customers who buy more than once. You calculate it by dividing your repeat customers by your total customers over a period, then multiplying by 100. A business with 5,000 customers in a year, 1,250 of whom bought again, runs a 25% repeat purchase rate.
You’ll see the same metric called repeat customer rate or returning customer rate. The ranges below are current as of mid-2026.
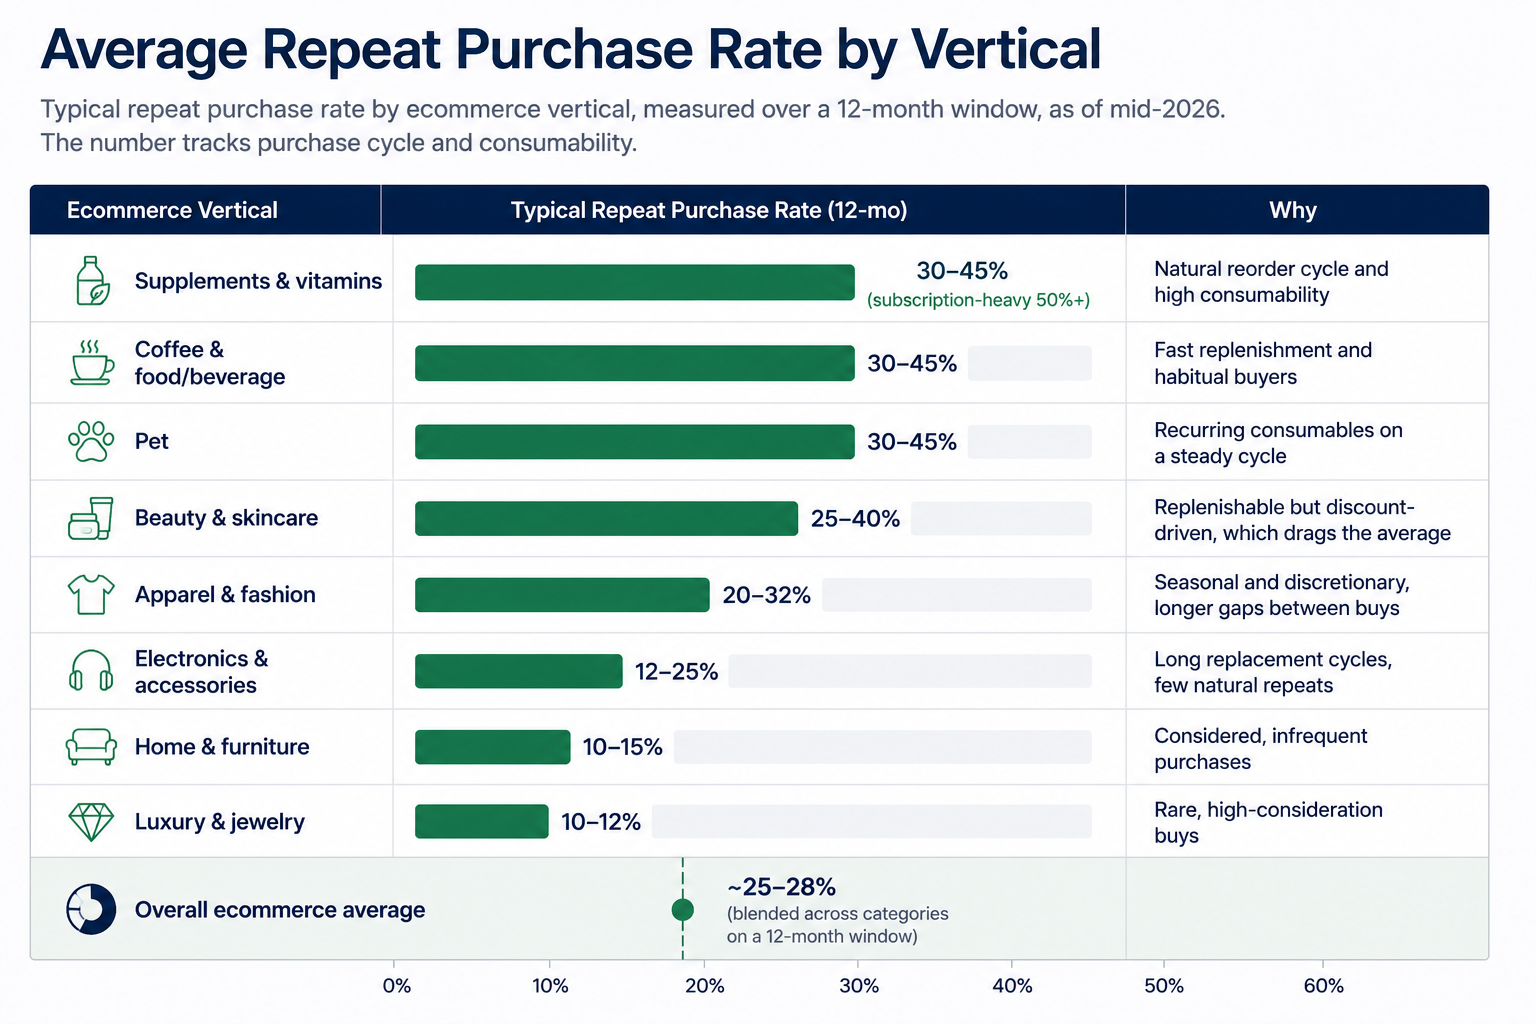
The average ecommerce repeat purchase rate is around 25–28% on a 12-month window in 2026. Consumable categories like supplements and coffee run above 40%, while considered or durable categories like furniture and luxury sit near 10–15%.
The right target depends on your purchase cycle far more than your industry’s headline number.
Repeat purchase rate benchmarks by vertical
There’s no single healthy repeat rate, because the number tracks your purchase cycle far more than how well you run retention. Categories with a natural reorder cycle, like supplements, coffee, and pet, sit at the top because customers come back on their own.
Considered or durable categories, like apparel, electronics, and furniture, sit at the bottom because nobody buys a sofa on a 30-day cycle.
Table 1. Typical repeat purchase rate by ecommerce vertical, measured over a 12-month window, as of mid-2026. The number tracks purchase cycle and consumability.
| Ecommerce vertical | Typical repeat purchase rate (12-mo) | Why |
| Supplements & vitamins | 30–45% (subscription-heavy 50%+) | Natural reorder cycle and high consumability |
| Coffee & food/beverage | 30–45% | Fast replenishment and habitual buyers |
| Pet | 30–45% | Recurring consumables on a steady cycle |
| Beauty & skincare | 25–40% | Replenishable but discount-driven, which drags the average |
| Apparel & fashion | 20–32% | Seasonal and discretionary, longer gaps between buys |
| Electronics & accessories | 12–25% | Long replacement cycles, few natural repeats |
| Home & furniture | 10–15% | Considered, infrequent purchases |
| Luxury & jewelry | 10–12% | Rare, high-consideration buys |
| Overall ecommerce average | ~25–28% | Blended across categories on a 12-month window |
Read your number against your own category, not the blended average. A 20% repeat rate is thin for a supplement brand and strong for a mattress brand.
The direction matters as much as the level: a repeat rate sliding quarter over quarter means each new cohort is coming back less often than the last, which is worth catching early.
The measurement window changes everything
Before you compare your repeat rate to any benchmark, check the window it was measured over. The window drives the number more than the vertical does. The same brand can look like a retention disaster or a retention machine depending on where you draw the line.
Table 2. The same illustrative brand’s repeat purchase rate at three windows, showing why the window has to match before any comparison means anything.
| Measurement window | Illustrative repeat rate | How to read it |
| 30-day | 10–15% | Only the fastest-cycle reorders have happened yet |
| 90-day | 25–30% | Captures most consumable reorders |
| 12-month | 40–45% | Full replenishment cycles are included |
A 12-month rate isn’t better than a 90-day rate; it’s a different measurement. Pick a window that fits your reorder cycle, monthly for consumables and 90 days or longer for apparel and durable goods, then hold it steady so you’re comparing like with like across periods and against your category.
Your real target is the second purchase, not the industry average
Chasing a blended repeat rate is the wrong goal, because the number is a lagging output of one specific event: whether a first-time buyer comes back for a second order. That first-to-second jump is the hardest step and the most predictive one, and each order after it raises the odds of the next.
Table 3. Rough odds of the next order by how many times a customer has already bought. Figures are illustrative; confirm against your own cohorts.
| Customer has made | Rough chance of the next order | Takeaway |
| 1 purchase | ~20–30% | The first-to-second jump is the hardest and most predictive |
| 2 purchases | ~45–50% | A second order roughly doubles the odds of a third |
| 3+ purchases | ~55–60% | The habit compounds once it forms |
This is why a small lift in repeat rate compounds. Move a few more first-time buyers into a second purchase and you feed the whole ladder, so lifetime value climbs faster than the headline percentage suggests.
It only counts once the repeat clears your contribution margin, the profit left on a sale before marketing, since a discounted reorder that loses money isn’t retention worth having. Repeat rate is one of the biggest levers on how customer value compounds over time.
Read repeat rate cohort by cohort
A single store-wide repeat rate blends every customer you’ve ever had, so it can drift up because your oldest customers have had years to buy again. That average can hold steady while recent cohorts quietly retain worse, and you won’t see the slide until it’s expensive to fix.
Grouping customers by the month they first bought fixes this. Cohorts show whether each new group repeats faster or slower than the last, and let you tie repeat rate to customer acquisition cost and payback rather than reading it in isolation.
Returns muddy the picture too, so watch your repeat rate next to your return rate, since a refunded reorder isn’t a real repeat. For subscription brands, subscription churn is the mirror image of the same number.
Repeat purchase rate is one of a handful of ecommerce KPIs that only make sense together. Read it alongside acquisition cost, margin, and net profit margin, because repeat revenue is only worth chasing when it leaves profit behind.
See where your repeat rate lands
A benchmark only helps if you can see your own number next to it. The CAC/LTV Cohort Analyzer groups your customers by the month they first bought, so you can watch repeat purchase rate build cohort by cohort, tie it to acquisition cost and payback, and catch whether retention is improving or the blended number is hiding a slide, in Excel or Google Sheets.
Set your window, match it to your reorder cycle, and read repeat rate the way it compounds into lifetime value.
Frequently asked questions
What is a good repeat purchase rate?
A good ecommerce repeat purchase rate is roughly 25–28% blended, but the right target depends on your category: consumables like supplements and coffee are healthy above 40%, apparel lands around 20–32%, and durable goods like furniture are fine near 10–15%. Compare within your own vertical and measurement window.
How do you calculate repeat purchase rate?
Divide the number of customers who bought more than once by your total number of customers over a set period, then multiply by 100. If 1,250 of 5,000 customers in a year made a second purchase, your repeat purchase rate is 25%. Always state the window, since it changes the result.
What is the average repeat customer rate in ecommerce?
The average repeat customer rate in ecommerce is about 25–28% on a 12-month basis as of mid-2026, though it swings from under 15% for furniture and luxury to over 45% for fast-cycle consumables. Repeat customer rate and repeat purchase rate are the same metric under different names.
Is repeat purchase rate the same as repeat customer rate?
Yes, repeat purchase rate and repeat customer rate measure the same thing: the share of customers who buy again over a period, sometimes also called returning customer rate or repurchase rate. The formula is identical, so the two terms are interchangeable in practice.
What measurement window should I use for repeat purchase rate?
Match the window to your natural reorder cycle: monthly or 90 days for consumables, and six to twelve months for apparel and durable goods. The key is consistency, since a 12-month window always reads higher than a 90-day one, and only like-for-like windows are comparable.
