
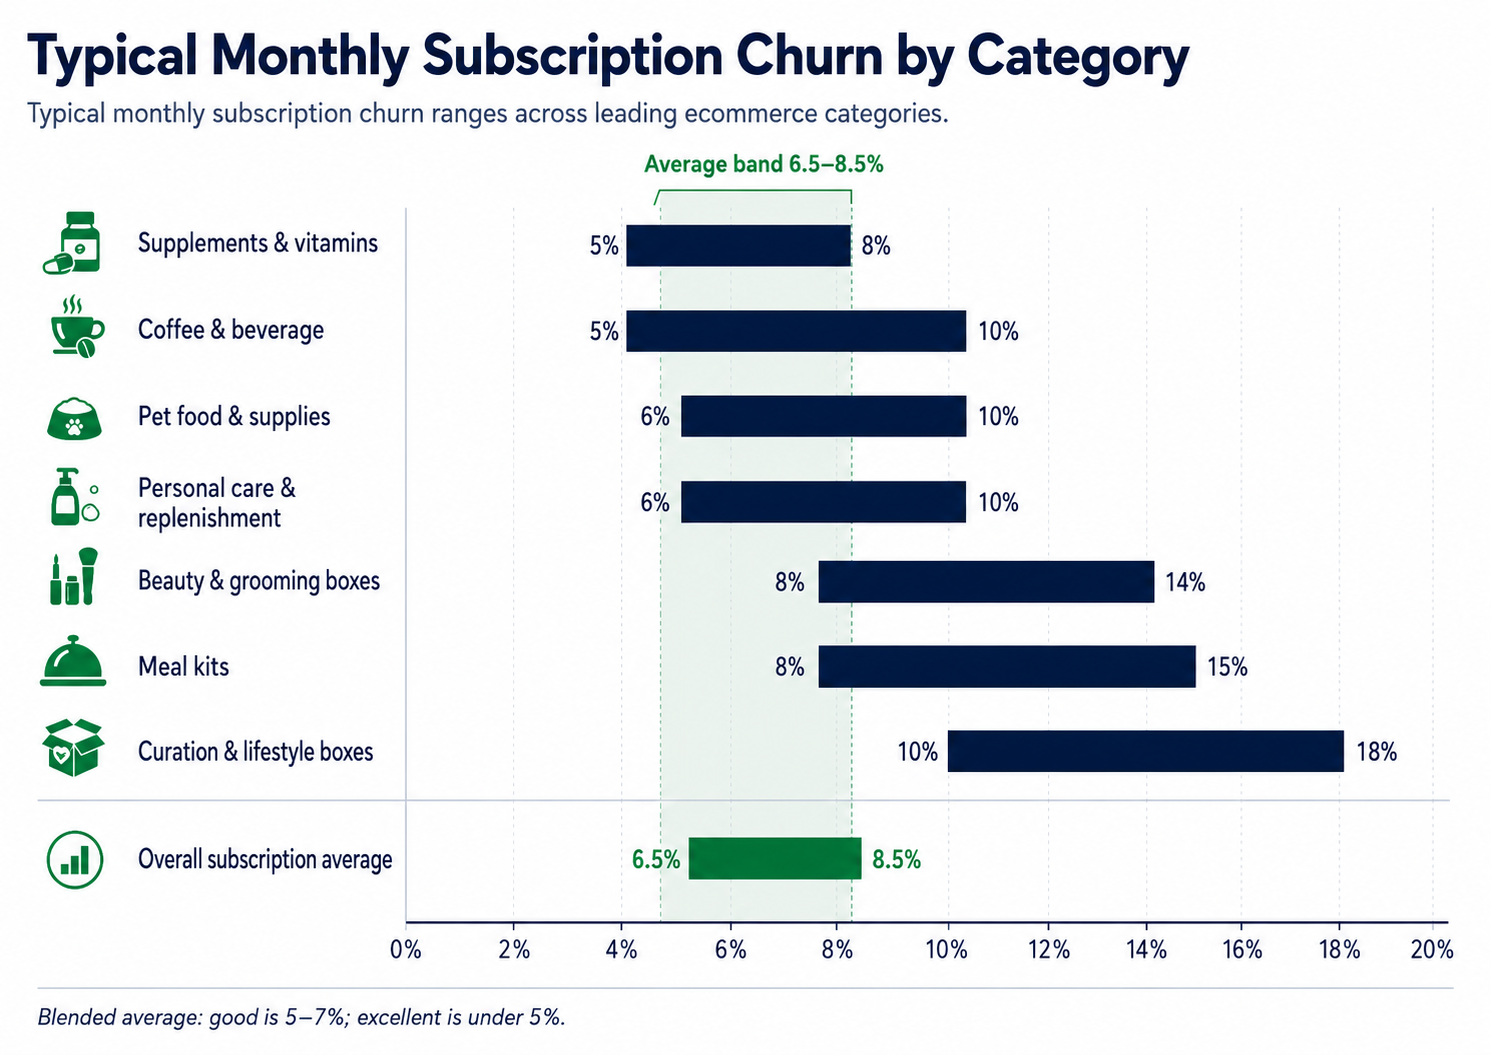
Average monthly subscription churn runs around 6.5–8.5%, but the number stays abstract until you turn it into time. At 5% monthly churn the average subscriber stays 20 months; at 10% they’re gone in 10. Here’s the churn benchmark by category, and how to read yours.
What’s the average subscription churn rate by category?
Average monthly subscription churn runs around 6.5–8.5% in 2026. A good rate is 5–7%, and consistently under 5% puts you in the top quartile. Replenishment categories sit at the low end and curation boxes at the high end, so the right target depends on your model far more than a single industry number.
Churn rate is the share of subscribers who cancel in a period. You calculate it by dividing the subscribers you lost by the subscribers you started the period with, then multiplying by 100.
Two things trip people up: whether the rate is monthly or annual, and whether it counts customers or revenue. We’ll take those one at a time. The ranges below are current as of mid-2026.
Subscription churn benchmarks by category
There’s no single healthy churn rate, because the number tracks whether your value is habitual or novelty-driven. Replenishment models like supplements, coffee, and pet food churn least, since the need recurs and the subscription saves the customer a trip.
Curation and box models churn most, because they lean on novelty and a discounted first order, and novelty fades once the introductory price ends.
Table 1. Typical monthly subscription churn by category, as of mid-2026. The number tracks habitual versus novelty-driven value and the size of the acquisition discount.
| Subscription category | Typical monthly churn | Why |
| Supplements & vitamins | 5–8% | Habitual replenishment with clear ongoing value |
| Coffee & beverage | 5–10% | Routine consumption, some flavor fatigue |
| Pet food & supplies | 6–10% | Steady need, but price-sensitive |
| Personal care & replenishment | 6–10% | Consumable and convenience-driven |
| Beauty & grooming boxes | 8–14% | Novelty-driven and often discount-acquired |
| Meal kits | 8–15% | High effort and easy to pause or skip |
| Curation & lifestyle boxes | 10–18% | Discretionary; churns most once novelty fades |
| Overall subscription average | 6.5–8.5% | Blended; good is 5–7%, excellent under 5% |
Read your number against your own model, not the blended average. A 9% monthly churn is a problem for a supplement brand and normal for a lifestyle box.
The direction matters as much as the level: churn creeping up month over month means each new cohort is leaving faster than the last, which is worth catching before it compounds.
Monthly churn compounds into your real retention
A monthly percentage is abstract until you convert it, and the two conversions that matter are subscriber lifetime and annual retention. A subscriber’s average lifetime is 1 divided by your monthly churn, so 5% churn gives you a 20-month subscriber and 10% churn cuts that to 10 months.
Annual retention compounds, so it isn’t twelve times the monthly rate. The share of a cohort still active after a year is (1 minus your monthly churn) to the twelfth power. At 5% monthly churn, about 54% of a cohort is still with you at 12 months; at 10%, only 28% is.
A few points of monthly churn swing lifetime and lifetime value hard, which is why we track churn as time rather than a flat percentage.
Table 2. Monthly churn converted into average subscriber lifetime and the share of a cohort still active at 12 months.
| Monthly churn | Avg subscriber lifetime | Still active at 12 months |
| 3% | ~33 months | ~69% |
| 5% | ~20 months | ~54% |
| 7% | ~14 months | ~42% |
| 10% | ~10 months | ~28% |
| 15% | ~7 months | ~14% |
This is the math behind how customer value compounds. Every extra month a subscriber stays is another cycle at your contribution margin, the profit left on a sale before marketing, so cutting churn from 8% to 6% doesn’t shave a couple of points off a chart.
It stretches the average subscriber from about 12 months to 17, and every one of those extra months earns.
Customer churn vs revenue churn, and why net matters
Losing subscribers and losing revenue aren’t the same thing, and reading only one hides half the picture. There are three numbers worth naming, and they answer different questions.
Customer churn, sometimes called logo churn, counts the subscribers who cancelled. Gross revenue churn counts the recurring revenue lost to cancellations and downgrades.
Net revenue churn nets in the revenue you gained back from upgrades, add-ons, and reactivations, which means it can turn negative when your existing base grows without a single new subscriber. That’s the healthiest number a subscription can post.
The gap between them tells a story. A brand can shed low-value subscribers while upselling the rest and still grow revenue, so its customer churn looks ugly while its net revenue churn is near zero.
Read all three together, and don’t judge the business on logo churn alone.
Most churn happens early, so read it in cohorts
A blended monthly rate hides the single most useful fact about subscription churn: it’s front-loaded. A large share of cancellations land right after the first delivery, before a habit forms, in what operators call the second-box problem.
The first box was discounted and built for the unboxing; the second arrives at full price with less novelty, and that’s where a measurable slice of subscribers leave.
Grouping subscribers by the month they joined is what surfaces this. A cohort view shows where each group’s retention curve bends, so you can see whether the drop is at month one or month six and aim your fix there.
It also ties churn to customer acquisition cost and payback, since a short subscriber lifetime can leave paid acquisition underwater no matter how good the headline churn looks. Churn is the subscription mirror of repeat purchase rate, and both belong in the same cohort report.
Table 3. Typical share of a joining cohort still subscribed over time, as of mid-2026.
| Months since joining | Typical still active | Top-quartile |
| Month 1 | 65–70% | 75%+ |
| Month 3 | 50–55% | 60%+ |
| Month 6 | 40–45% | 50%+ |
| Month 12 | 30–35% | 50%+ |
A steep early drop that flattens out is normal for subscriptions, so don’t panic at the month-one cliff. Watch instead whether each new cohort holds better than the last, and whether the survivors past month six stick, since those are the subscribers who carry your lifetime value and your net profit margin.
See where your churn lands
A benchmark only helps if you can see your own number next to it. The CAC/LTV Cohort Analyzer groups your subscribers by the month they joined, so you can watch churn and subscriber lifetime build cohort by cohort, tie them to acquisition cost and payback, and catch the cohorts that drop off after the first delivery.
Turn your monthly churn into a lifetime, then watch whether each new cohort holds better than the last.
Frequently asked questions
What is a good churn rate for a subscription business?
A good monthly subscription churn rate is 5–7%, with anything under 5% putting you in the top quartile. The right target depends on your category: replenishment models like supplements and coffee should sit at the low end, while curation and box models run higher at 8–18%. Compare within your own category and billing period.
How do you calculate subscription churn rate?
Divide the subscribers you lost during a period by the number you had at the start, then multiply by 100. If you began the month with 2,000 subscribers and 120 cancelled, your monthly churn is 6%. State the period every time, since a monthly rate compounds into a much larger annual figure.
What is the average churn rate for subscription boxes?
Subscription boxes average roughly 8–18% monthly churn, the highest in ecommerce, because they depend on novelty and discount-led acquisition. Curation and lifestyle boxes sit at the top of that range, meal kits run 8–15%, and beauty boxes land around 8–14%. Replenishment subscriptions churn far less at 5–10%.
What's the difference between gross and net revenue churn?
Gross revenue churn counts only the recurring revenue lost to cancellations and downgrades, while net revenue churn subtracts the revenue you win back through upgrades, add-ons, and reactivations. Net churn can go negative when expansion outpaces losses, which means the existing base is growing on its own. Track both alongside customer churn.
How do you convert monthly churn to annual churn?
Annual retention is (1 minus your monthly churn rate) raised to the twelfth power, and annual churn is one minus that. At 5% monthly churn, about 54% of subscribers remain after a year, so annual churn is roughly 46%. Monthly churn compounds, so annual churn is always less than twelve times the monthly rate.
Key takeaways
- Average monthly subscription churn runs about 6.5–8.5% in 2026; a good rate is 5–7%, and anything under 5% is top-quartile.
- Churn rate is subscribers lost divided by subscribers at the start of the period, times 100; always say whether it’s monthly or annual, since a monthly rate compounds.
- A subscriber’s average lifetime is 1 ÷ monthly churn, so 5% churn means a 20-month subscriber and 10% churn means 10 months.
- Replenishment categories like supplements, coffee, and pet churn least at 5–10% monthly, while curation and box models run 8–18%.
- Customer churn, gross revenue churn, and net revenue churn are three different numbers, and net churn can go negative when expansion outweighs cancellations.
