
Key takeaways
- Burn rate is how much cash a business spends each month; net burn subtracts the revenue you collect, while gross burn counts every dollar going out.
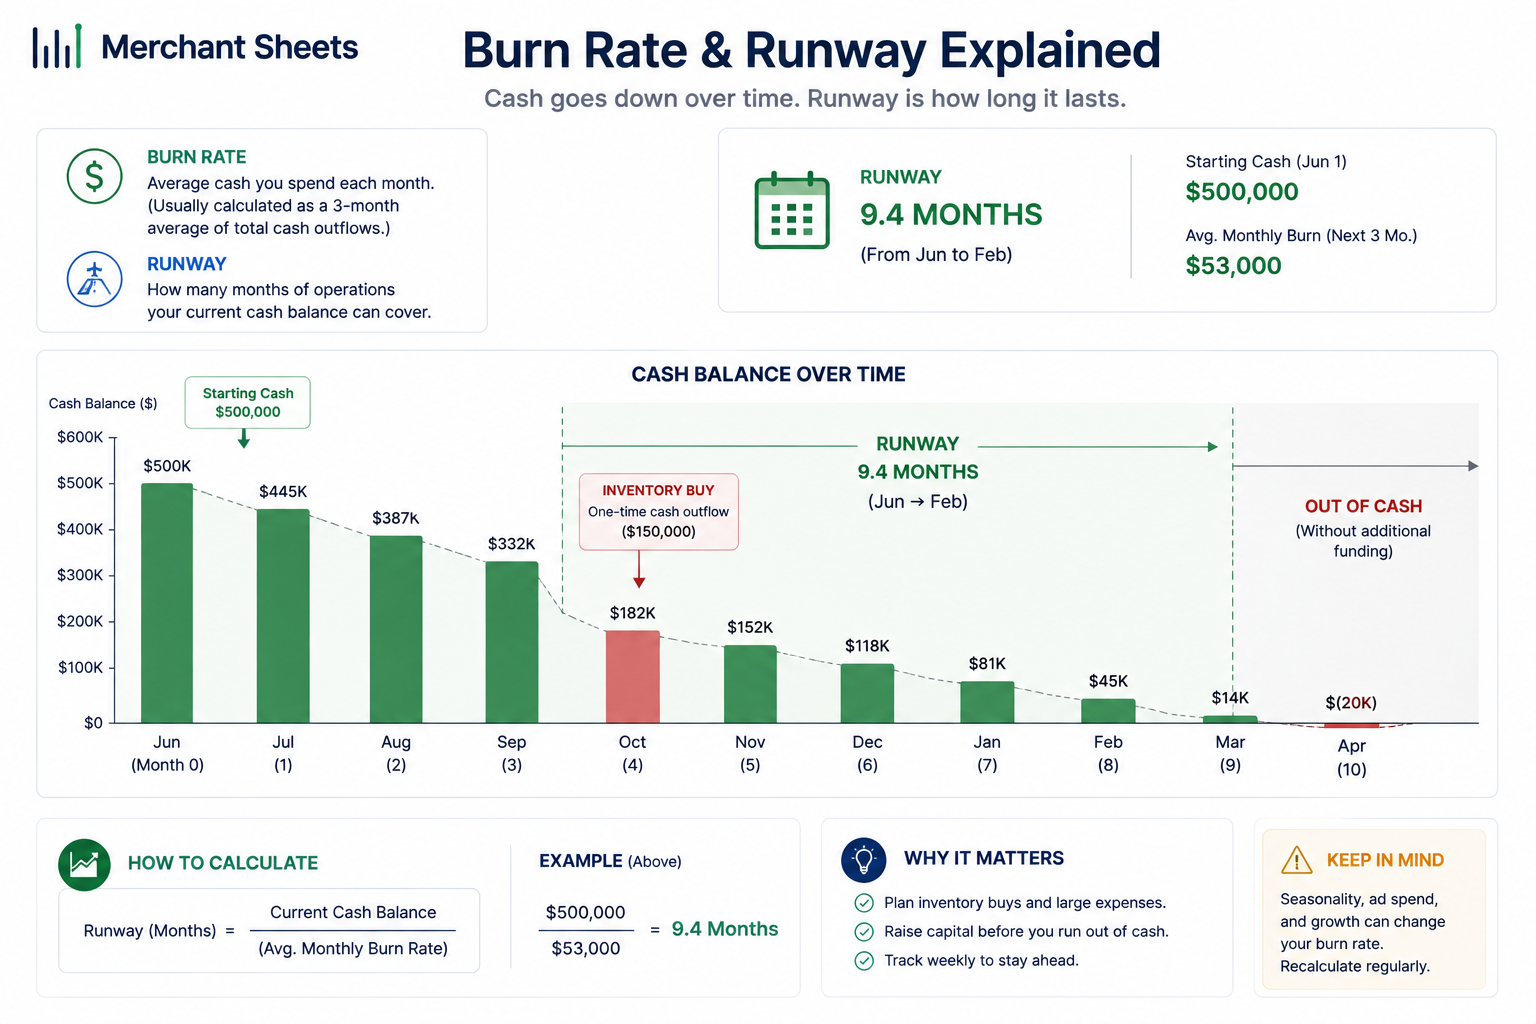
- Cash runway equals cash on hand divided by net monthly burn, which tells you how many months you can operate before the money runs out.
- When people say “burn rate” they almost always mean net burn, because net burn is what drains the bank account.
- For an inventory-led ecommerce brand, burn is lumpy and seasonal, so a trailing monthly average can hide the month the cash runs dry.
- You extend runway by cutting net burn or adding cash: turn inventory faster, tighten the cash conversion cycle, and time big inventory buys to your strongest-cash weeks.
Burn rate is how much cash your business spends each month, and runway is how many months that cash will last at the current pace. Together they answer the question every operator asks when the bank balance dips: how long can the brand last?
For an ecommerce business the twist is that burn is lumpy. A single inventory buy can drain months of cash in a few weeks, so the average hides the month you run dry. Here are the formulas, a worked example, and the levers that stretch your runway.
What is burn rate?
Burn rate is the pace at which your business spends its cash reserves, usually measured per month. It tells you how fast the account is emptying, and paired with your cash balance, how long the business can keep operating. The term comes from startup finance, where a company spends investor cash ahead of profits, and it applies to any brand that wants to know how much cushion it has.
Two numbers sit inside it: gross burn and net burn. The next section splits them, because the difference decides how you read your runway.
Gross burn vs net burn
Gross burn is the total cash your business spends in a month: inventory, payroll, ad spend, software, rent, and fees, every dollar that leaves the account. Net burn is that number minus the cash you collect in the same month. Net burn is the true rate your reserves deplete, so when someone says “burn rate” without qualifying it, they mean net burn.
The gap matters most for ecommerce, because gross burn spikes when you place a big inventory order. You can post a profitable month on paper and still watch gross burn jump the week a container gets paid for. Tracking both keeps you honest: gross burn shows where the money goes, and net burn shows how fast the cushion shrinks.
How to calculate burn rate and runway
Start with net burn, then divide your cash by it. Three steps:
- Add up the cash that left the business this month. That’s your gross burn.
- Subtract the cash you collected this month. What’s left is your net burn.
- Divide your cash on hand by net monthly burn. The result is your runway in months.
The two formulas, plainly:
Net burn = monthly cash out − monthly cash collected
Cash runway (months) = cash on hand ÷ net monthly burn
Take a brand holding $600,000 in cash. In a normal month it spends $150,000 and collects $100,000, so net burn is $50,000. Divide $600,000 by $50,000 and the brand has 12 months of runway.
Table 1. Net burn and runway for a brand with $600,000 in cash.
| Line | Amount |
| Cash on hand | $600,000 |
| Monthly cash out (gross burn) | $150,000 |
| Monthly cash collected | $100,000 |
| Net burn | $50,000 |
| Runway | 12 months |
Why does the monthly average mislead for ecommerce?
Because burn for an inventory-led brand isn’t a smooth line. Cash pours out when you buy stock ahead of a season, then flows back as that stock sells. A brand can look fine on a trailing-twelve-month average and still hit zero in August, because the Q4 inventory buy landed in Q3 and drained three months of cushion in one.
Picture the same brand. It buys holiday inventory in September, pushing that month’s cash out to $220,000 while collections hold at $100,000. Net burn for September is $120,000 instead of $50,000, and the runway math that looked comfortable in June now points at a shortfall before the holiday revenue arrives.
Table 2. The same brand’s cash through a September inventory buy.
| Month | Cash out | Collected | Net burn | Cash left |
| August | $150,000 | $100,000 | $50,000 | $550,000 |
| September | $220,000 | $100,000 | $120,000 | $430,000 |
| October | $160,000 | $110,000 | $50,000 | $380,000 |
So read runway off the low point rather than the average. The cash that vanishes in September is cash tied up in inventory, the working capital that a longer cash conversion cycle keeps locked away.
| Profitable on paper, out of cash in August. A brand can post a healthy margin and still run dry because the money is sitting in inventory, waiting on the holiday sell-through. |
That trough is what your cash flow forecast is for: it lays the weeks out so you see the low point before you reach it.
What’s a good runway?
There’s no universal number, because a healthy runway depends on your stage and how reliably cash comes in. A funded brand often aims for 18 to 24 months so it can operate and raise the next round without pressure. A self-funded ecommerce brand faces a different test: the runway has to clear the next inventory cycle and the slow season with room to spare, whatever the month count works out to.
As rough guardrails, as of early 2026:
Table 3. Runway guardrails for an ecommerce brand.
| Runway | What it signals |
| Under 6 months | A caution flag; protect cash and line up options before you buy heavy. |
| 6–12 months | Workable for a self-funded brand with steady collections and a planned buy calendar. |
| 18–24 months | The cushion funded brands target to cover operations and a raise. |
A high burn on its own doesn’t spell trouble. When it’s a planned inventory build with revenue close behind, and your runway still clears the season, the burn is doing its job. Read the burn through the lens of runway.
How to extend your runway
Every lever below either cuts net burn or adds cash, and the biggest wins in ecommerce come from the cash trapped in inventory. Pair them with the 13-Week Cash Flow Forecast so you can watch each change land before it hits the account.
- Turn inventory faster: Every extra inventory turn pulls cash off the shelf and back into the bank, so less of your revenue sits as stock. It’s the largest lever for most brands.
- Tighten the cash conversion cycle: Stretch supplier terms to hold cash longer, and speed up marketplace payouts to get cash sooner. Both shrink the gap that drives net burn.
- Lift your free cash flow margin: Trim recurring costs and clear slow SKUs so more of each sale survives as cash. A wider margin lowers net burn month after month.
- Time big buys to strong-cash weeks: Line up large inventory orders with the weeks your forecast shows the most cushion, so one outflow doesn’t sink the period.
- Trim gross burn where it’s safe: Cut software you don’t use and renegotiate vendor terms while leaving growth spend intact. Lower fixed cash costs extend every future month.
- Grow revenue efficiently: Raise prices or lift average order value where the market allows, so more cash lands without a matching rise in cost.
Know your runway before it gets short
You can calculate your burn rate and runway once on the back of an envelope, but the number that matters moves every week as bills clear and payouts land.
The 13-Week Cash Flow Forecast projects your cash in and cash out week by week, carries each week’s closing balance into the next, and shows the inventory buys that spike your burn while there’s still time to act.
Fill in your receipts and payments, and you’ll see the low point in your runway before you reach it.
Frequently asked questions
What is a good burn rate?
There’s no single good burn rate; a healthy burn is one your runway can support given your stage and how fast cash comes back. A brand with 18 months of runway and a clear path to revenue can run a high burn comfortably, while the same burn on four months of cash is a problem. Measure burn against runway, and the number tells you far more than the burn alone.
Is a high burn rate bad?
Not on its own; a high burn is fine when it’s a planned inventory build with revenue close behind and enough runway to clear the season. It turns risky when the spending is unplanned, when collections slip, or when runway drops under a few months. The burn itself is neutral, and what matters is whether the cash it buys comes back in time.
What’s the difference between burn rate and runway?
Burn rate is how much cash you spend in a month, and runway is how many months of that spending your cash can cover. Burn is the speed; runway is the distance left in the tank. You get runway by dividing cash on hand by net monthly burn.
How do you calculate cash runway?
Divide your cash on hand by your net monthly burn. A brand with $600,000 in cash burning $50,000 a month net has 12 months of runway. For a seasonal business, run it off your leanest projected month so the number reflects the real low point instead of a flat average.
Does burn rate use gross or net burn?
Runway uses net burn, because net burn is the cash your reserves lose each month after collections. Gross burn is useful for spotting spending spikes, like a large inventory order, though dividing cash by gross burn would understate your runway. Use net burn for runway and watch gross burn for where the money goes.
