
Key takeaways
- A chart of accounts is the master list of accounts every transaction posts to; an ecommerce one needs accounts a generic template leaves out, so the books report the way an online business earns and spends.
- Number it in clean bands: 1000 assets, 2000 liabilities, 3000 equity, 4000 income, 5000 cost of goods sold, 6000 operating expenses, and 7000 other, keeping cost of goods sold and operating expenses in separate bands.
- Treat channel as a dimension, not duplicate accounts: keep one Product Sales account and tag it by channel with a class in QuickBooks or a tracking category in Xero, instead of splitting it into Shopify Sales and Amazon Sales.
- Build in the accounts ecommerce needs: a clearing account per channel, marketplace pending and reserve balances, the marketplace fee stack, sales tax as a liability, and inventory as an asset.
- Put variable per-order fees like referral, FBA, and payment processing in cost of goods sold, and fixed platform plans like the Shopify or Amazon monthly fee in operating expenses, so contribution margin stays clean.
- Keep the chart lean, around 40 to 60 purpose-built accounts for most brands, and get finer detail from channel and SKU tags rather than from hundreds of extra accounts.
Most accounting software ships with a generic chart of accounts, and for an ecommerce business it’s wrong out of the box. There’s no clearing account, no marketplace fees, no place for the tax a marketplace remits for you.
Here’s a chart of accounts built for how online brands really earn and spend, and the design choices that keep it working as you grow.
What is a chart of accounts, and why does ecommerce need its own?
A chart of accounts is the master list of every account your transactions post to, the buckets behind your profit and loss statement and balance sheet. An ecommerce chart of accounts adds what an online business needs that a generic template skips: a clearing account for each channel’s payouts, the marketplace fee stack, sales tax as a liability, and inventory as an asset.
A clearing account is a holding account where a channel’s sales sit between the order and the payout.
The default chart in QuickBooks or Xero assumes the money in your bank is revenue and every cost is a simple bill. Ecommerce breaks both assumptions. A payout arrives net of fees and tax, a marketplace holds a reserve, and inventory ties up cash long before it becomes a cost.
The broader workflow of keeping the books is covered in the complete ecommerce bookkeeping guide; this article is the account structure that workflow runs on.
The five account types and a clean numbering scheme
Every chart of accounts is built from five types, in this order: assets (what you own), liabilities (what you owe), equity (the owner’s stake), income (what you earn), and expenses (what you spend to earn it). Numbering them in bands keeps the chart sorted and leaves room to add accounts without renumbering.
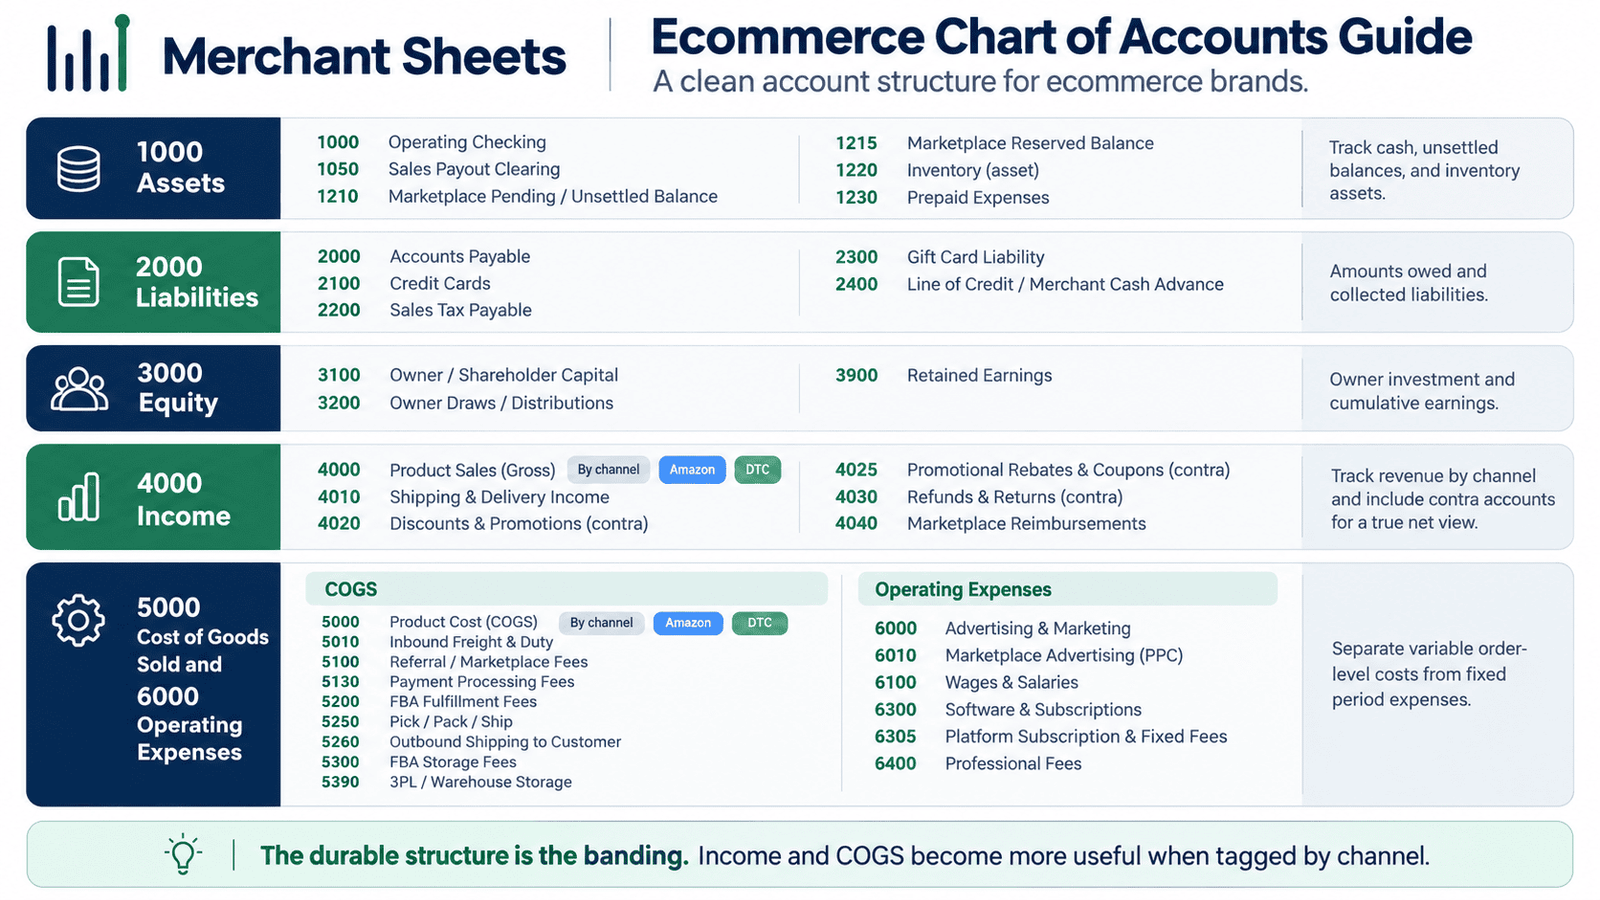
Use 1000 for assets, 2000 for liabilities, 3000 for equity, 4000 for income, 5000 for cost of goods sold (COGS), 6000 for operating expenses, and 7000 for other income and expense.
The one ecommerce-specific move here is to keep cost of goods sold in its own 5000 band, separate from operating expenses in 6000. Plenty of charts lump both into 5000, which blurs the line between what a sale costs and what the business costs.
Splitting them is what lets a profit and loss (P&L) statement show gross margin, then contribution, then operating income cleanly. Here’s a working example you can copy and adapt.
An example ecommerce chart of accounts. The codes are illustrative; the bands are the durable part, so adjust the numbers to your own scheme.
| Code | Account | Channel tag |
| 1000 Assets | ||
| 1000 | Operating Checking | – |
| 1050 | Sales Payout Clearing | By channel |
| 1210 | Marketplace Pending / Unsettled Balance | By channel |
| 1215 | Marketplace Reserved Balance | Amazon |
| 1220 | Inventory (asset) | – |
| 1230 | Prepaid Expenses | – |
| 1700 | Fixed Assets (equipment, etc.) | – |
| 2000 Liabilities | ||
| 2000 | Accounts Payable | – |
| 2100 | Credit Cards | – |
| 2200 | Sales Tax Payable | By channel |
| 2300 | Gift Card Liability | By channel |
| 2400 | Line of Credit / Merchant Cash Advance | By channel |
| 2600 | Long-Term Debt | – |
| 3000 Equity | ||
| 3100 | Owner / Shareholder Capital | – |
| 3200 | Owner Draws / Distributions | – |
| 3900 | Retained Earnings | – |
| 4000 Income | ||
| 4000 | Product Sales (Gross) | By channel |
| 4010 | Shipping & Delivery Income | By channel |
| 4020 | Discounts & Promotions (contra) | By channel |
| 4025 | Promotional Rebates & Coupons (contra) | Amazon |
| 4030 | Refunds & Returns (contra) | By channel |
| 4040 | Marketplace Reimbursements | Amazon |
| 5000 Cost of Goods Sold (variable, per order) | ||
| 5000 | Product Cost (COGS) | By channel |
| 5010 | Inbound Freight & Duty | By channel |
| 5100 | Referral / Marketplace Fees | Amazon |
| 5130 | Payment Processing Fees | DTC |
| 5140 | Platform Transaction Fees | DTC |
| 5200 | FBA Fulfillment Fees | Amazon |
| 5250 | Pick / Pack / Ship (DTC / 3PL) | By channel |
| 5260 | Outbound Shipping to Customer | By channel |
| 5300 | FBA Storage Fees | Amazon |
| 5390 | 3PL / Warehouse Storage | DTC |
| 6000 Operating Expenses (fixed / period) | ||
| 6000 | Advertising & Marketing | By channel |
| 6010 | Marketplace Advertising (PPC) | Amazon |
| 6100 | Wages & Salaries | – |
| 6300 | Software & Subscriptions | – |
| 6305 | Platform Subscription & Fixed Fees | By channel |
| 6400 | Professional Fees (Legal / Accounting) | – |
| 7000 Other Income & Expense | ||
| 7100 | Interest Expense | – |
| 7900 | Income Tax Expense | – |
The ecommerce accounts a generic chart of accounts leaves out
The accounts that make a chart ecommerce-ready are the ones a generic template skips. A clearing account holds each channel’s sales between the order and the payout, so the deposit has a clean home instead of a forced match.
A reserve or pending-balance account tracks the money a marketplace is holding back. The marketplace fee stack, referral, fulfillment, storage, and payment processing, gets its own lines so you can see what selling costs. The fee stacks differ by channel: the Amazon side runs through Amazon seller bookkeeping, the payout side of your own site through Shopify accounting.
Two more trip people up. Sales tax is a liability, not income: on your own site you collect it and owe it, while on a marketplace the platform collects and remits it for you, so that tax posts as a pass-through rather than your revenue or your bill. That split follows from where you have sales tax nexus.
And discounts, refunds, and returns are contra-revenue accounts that reduce sales rather than expenses, so net revenue reads true. Inventory is an asset until it sells, then it moves to cost of goods sold, with the landed-cost detail in how to calculate COGS.
| A generic chart of accounts assumes the money you bank is your revenue. Ecommerce breaks that: build in a clearing account per channel, the marketplace fee stack, and sales tax as a liability, or the books never tie. |
Separate accounts per channel, or one account tagged by channel?
Keep one account and tag it by channel for anything the channels share, product sales, fees, and cost of goods sold, and give a channel its own account only where the money is genuinely separate, its clearing and reserve balances.
Tag with a class in QuickBooks Online or a tracking category in Xero; the mechanics differ a little between the two, and the trade-offs are in QuickBooks vs Xero.
A class and a tracking category are the same idea: a label you attach to a transaction so one account can report several ways.
The reason matters. Duplicating every account into Shopify Sales, Amazon Sales, Shopify Fees, and Amazon Fees doubles the chart and still can’t show a clean blended total. One Product Sales account tagged by channel gives you both the per-channel and the combined view from a single line, and it doesn’t balloon when you add a third channel.
Using that tag to produce a channel-level profit and loss statement is covered in multi-channel ecommerce accounting; here it’s an account-design choice. Here’s what to separate and what to tag.
What to give its own account, and what to tag by channel instead.
| Account | Separate per channel? | How to handle it |
| Sales payout clearing | Yes, one per channel | Each channel settles on its own cycle |
| Reserve / pending balance | Yes, where funds are held | Mainly Amazon and any channel that reserves |
| Product sales | No | One account, tagged by channel (class or tracking category) |
| Fees and cost of goods sold | No | One account each, tagged by channel for channel margin |
| Sales tax | Split | Own-site is your payable; marketplace is a pass-through, generally not your liability |
Where do platform fees go, cost of goods sold or operating expenses?
Variable fees that move with each order, referral, FBA (Fulfillment by Amazon), and payment processing, belong in cost of goods sold, above the contribution line. Fixed platform plans you pay no matter what you sell, the Shopify or Amazon monthly subscription, belong in operating expenses.
Splitting them this way keeps per-order contribution margin honest and stops a fixed cost from distorting your unit economics.
It’s a small distinction that changes what your margins tell you. If the monthly platform fee sits in cost of goods sold, every SKU (stock keeping unit) looks less profitable at low volume and better at high volume for no real reason.
Keep the fixed plan in operating expenses and the per-order fees in cost of goods sold, and contribution margin reflects the sale itself.
Advertising is the swing line: it’s an operating expense in a traditional profit and loss statement, and some brands move it above the contribution line to judge each channel after ad spend. Here’s where the common costs land.
Where each ecommerce cost belongs.
| Cost | Where it goes | Why |
| Referral, FBA, payment processing (per order) | Cost of goods sold | Varies with each sale, so it sits above contribution |
| Shopify / Amazon monthly plan (fixed) | Operating expenses | Fixed period cost; keeps per-order contribution clean |
| Sponsored ads / PPC | Advertising (opex, or above contribution) | A swing line, placed by the view you want |
| Landed cost of the product | Cost of goods sold | The direct cost of the unit you sold |
How do you build your ecommerce chart of accounts, step by step?
You can stand up an ecommerce chart of accounts in an afternoon by starting from the five account types, adding the ecommerce-specific accounts, and deciding your channel tags once. Work through these steps:
- Start from the five bands: assets, liabilities, equity, income, and split expenses into cost of goods sold and operating expenses.
- Add the ecommerce accounts a generic chart skips: a clearing account per channel, marketplace pending and reserve balances, the fee-stack lines, sales tax payable, and inventory.
- Decide your channel dimension: turn on classes in QuickBooks Online or tracking categories in Xero, and tag the shared income, fee, and cost of goods sold accounts by channel.
- Set discounts, refunds, and returns as contra-revenue, and confirm sales tax posts to a liability, split between your own site and marketplace pass-through.
- Keep it lean: add an account only when a number needs its own home, and get finer cuts from channel and SKU tags instead of new accounts.
- Map your settlement connector to it, so each channel’s payouts post into these accounts automatically, the A2X setup is walked through in connecting Shopify and Amazon to QuickBooks.
How many accounts do you really need?
Fewer than the internet suggests. Some published ecommerce charts run to several hundred accounts, which reads as thorough and works as a filing nightmare, because every extra account is one more place to miscode a transaction.
Most brands run well on 40 to 60 purpose-built accounts. The rule is short: add an account only when a number needs to stand on its own in a report, and get finer detail from tags, channel and SKU, rather than from more accounts.
A lean chart also feeds the rest of the system cleanly. It’s the structure a settlement connector posts into, the structure your channel tags roll up from, and the structure your profit and loss statement and balance sheet are built on.
Get it right once and every month’s reconciliation and reporting gets easier. Keep the chart as the stable spine, and let tags and templates do the slicing.
Frequently asked questions
What accounts do I need for a Shopify and Amazon business?
At minimum, you need a clearing account per channel, a marketplace reserve or pending balance, inventory, product sales and shipping income, contra-revenue accounts for discounts and returns, the marketplace fee stack in cost of goods sold, sales tax payable, and standard operating expenses, all tagged by channel where they’re shared. That set is what lets the books tie to your payouts and report by channel.
Should I have separate accounts for each sales channel?
Only for clearing and reserve balances, which genuinely settle separately; for shared accounts like sales, fees, and cost of goods sold, keep one account and tag it by channel with a class or tracking category. That gives you both the per-channel and the blended view without doubling the chart.
How many accounts should an ecommerce chart of accounts have?
Most brands run well on 40 to 60 purpose-built accounts, adding one only when a number needs its own home in a report. Finer detail should come from channel and SKU tags rather than from hundreds of extra accounts that create more places to miscode.
Can I use a default QuickBooks or Xero chart of accounts for ecommerce?
Not as it ships, because the default has no clearing accounts, no marketplace fee lines, and no place for facilitator sales tax. You’d adapt it by adding those accounts before the books can reconcile to your payouts.
What is a clearing account, and do I need one?
A clearing account holds a channel’s sales between the order and the payout, so the net deposit reconciles cleanly instead of being force-matched to sales. An ecommerce business needs one per channel, because each channel pays out on its own cycle.
How do I set up a chart of accounts in QuickBooks for ecommerce?
Start from the five account bands, add the ecommerce-specific accounts, turn on classes to tag channels, and set your contra-revenue and sales-tax-liability accounts, then map your settlement connector to post into it. Keeping it lean at setup saves re-coding history later.
Is the chart of accounts the same as the profit and loss statement?
No, the chart of accounts is the master list of accounts, while the profit and loss statement and balance sheet are reports built from those accounts. The chart’s structure decides what your statements can show, which is why the design choices matter.
What if I set an account up wrong or need to change it later?
You can rename or merge accounts, but changing the structure after months of data means re-coding history, so it’s worth getting the shape right at setup. That’s part of why a clean chart is easier to build than to untangle later.
Get your chart of accounts built for how you sell
A chart of accounts is the one setup decision that shapes every report you’ll ever run, and ecommerce is where a generic one quietly breaks, no clearing accounts, no fee lines, sales tax booked as income.
Structuring it right, the channel tags, the fee placement, the tax split, is the accounting setup I do for ecommerce brands, and I build it inside QuickBooks or Xero so your books report by channel from the first month.
If your accounts are a tangle of duplicates or a default list that never fit how you sell, tell me how your business runs and I’ll map the chart your books should stand on.
