
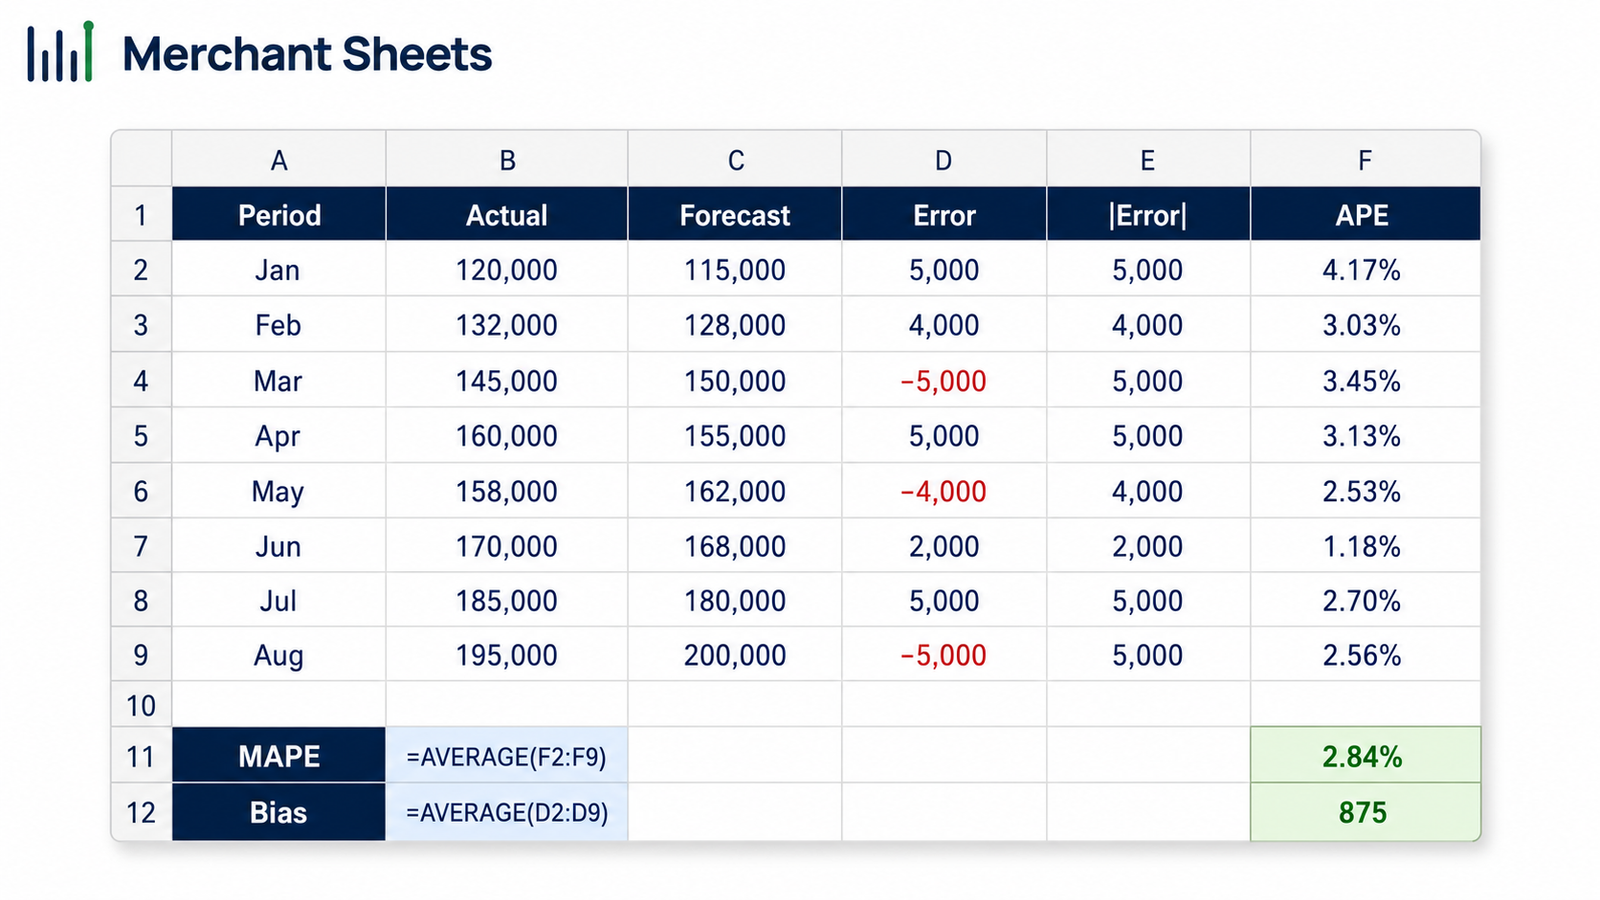
A forecast you never score never improves. Forecast error turns “the forecast felt off” into a number you can act on, and two metrics carry most of the weight: MAPE tells you how far off you are, and bias tells you which way you lean. Both take about five minutes to build once your actuals and forecasts sit side by side.
This guide builds the error column from scratch, rolls it up into MAPE and bias, and shows you which accuracy metric to trust for one SKU versus a whole catalog.
What is forecast error?
Forecast error is the gap between what you forecast and what demand came in, measured one period at a time. The formula is one line: forecast error = actual demand minus forecast. A positive number means demand beat your forecast; a negative number means you forecast too high. That single column is the raw material for every accuracy metric that follows.
One rule decides whether any of it is trustworthy: score against true demand. A month you sold out early records fewer units than customers wanted, so measuring error against recorded sales quietly flatters a forecast that missed.
Use demand, and if you’re not sure why sales and demand diverge, the demand forecasting methods guide covers it in full.
| Measure error against demand, not sales. A stockout caps recorded sales below true demand, so scoring against sales flatters a forecast that missed. |
Set up your forecast-error table in Excel
Start with three columns: the period, the actual demand, and the forecast you made for it. If you don’t have a forecast yet, build the forecast in Excel first, then come back to score it. Accuracy is the checkpoint in a larger inventory planning framework, so the inputs are worth getting right. You need saved forecast history matched to actuals, so keep a dated record of each forecast rather than overwriting it every month.
Measure over a consistent horizon too, ideally the forecast you made one supplier lead time back, since that’s the last forecast you could have acted on.
Then add three working columns with these formulas:
| Error = actual – forecast (=B2-C2) Absolute error = =ABS(B2-C2) Absolute % error (APE) = =ABS(B2-C2)/B2 |
Here’s a single SKU carried through all three, using six months of unit demand against the forecast each month:
Table: actual vs forecast with error, absolute error, and APE
| Month | Actual | Forecast | Error | |Error| | APE |
| Jan | 120 | 130 | -10 | 10 | 8.3% |
| Feb | 135 | 128 | 7 | 7 | 5.2% |
| Mar | 150 | 140 | 10 | 10 | 6.7% |
| Apr | 140 | 150 | -10 | 10 | 7.1% |
| May | 160 | 150 | 10 | 10 | 6.3% |
| Jun | 175 | 160 | 15 | 15 | 8.6% |
With those columns in place, every accuracy metric is a one-cell roll-up of the error, absolute error, or APE column.
How do you calculate MAPE in Excel?
MAPE, the mean absolute percentage error, is the average of the APE column. In Excel it’s a single formula over the range you built: =AVERAGE(F2:F7), where column F holds each period’s APE. You can also skip the helper column with an array formula, =AVERAGE(ABS(B2:B7-C2:C7)/B2:B7), entered across the actual and forecast ranges.
For the SKU above, MAPE comes to 7.0%, so the forecast is off by about 7% in a typical month. That reads cleanly and travels well in a report, which is why MAPE is the metric most people reach for first.
Two limits keep it honest. MAPE is undefined when actual demand is zero, because you can’t divide by zero, and it inflates hard on low-volume SKUs where a miss of a few units is a large percentage. So don’t average MAPE across a mixed catalog of fast and slow sellers; it will make your slow movers dominate the number.
How do you calculate forecast bias in Excel?
Bias is the average of the signed error column, before you take absolute values: =AVERAGE(D2:D7), where column D is actual minus forecast. Because the positives and negatives stay in, bias tells you direction rather than size. A positive bias means actuals keep landing above your forecast, so you’re under-forecasting and courting stockouts; a negative bias means you’re over-forecasting and building excess stock.
This is why one metric isn’t enough. The example SKU posts a tidy 7% MAPE, but its bias is positive 3.7 units: the forecast sits consistently below a rising demand line, a systematic under-forecast that MAPE alone hides.
Left unchecked, that same lean shows up as repeated stockouts, or the opposite lean shows up as excess stock you’d watch drain your weekly cash flow. Read the two together and the fix becomes obvious, which is to lift the forecast or switch to a method that tracks the trend.
To catch bias building up over time, add a tracking signal: the running sum of the signed errors divided by the MAD (mean absolute deviation). As long as it stays inside roughly plus or minus four, the forecast is in control; past that, it’s drifting one way and the method needs a look.
When either bias or MAPE goes out of range, that’s your cue to re-pick the forecasting method.
MAPE, MAD, WAPE, or RMSE: which error metric should you use?
The metric you report should match what you’re measuring. One steady SKU in units wants MAD; a whole catalog wants WAPE; a percentage for a slide wants MAPE on a stable item; and a process where big misses are expensive wants RMSE. Bias and the tracking signal ride alongside any of them to catch systematic error.
Table: forecast error metrics and when to use each
| Metric | Formula | Best for | Watch-out |
| MAPE (mean absolute % error) | average of |actual – forecast| / actual | A single steady SKU; reporting error as a % | Over-weights low-volume SKUs; undefined at zero demand |
| MAD / MAE (mean absolute error) | average of |actual – forecast| | A single SKU, in units | Not comparable across SKUs of different volume |
| WAPE (weighted absolute % error) | sum of |actual – forecast| / sum of actual | A whole catalog; weights by volume | Big SKUs dominate (usually what you want) |
| RMSE (root mean squared error) | square root of the average of (actual – forecast) squared | When large misses hurt most | Harder to explain; sensitive to outliers |
| Bias (mean error) | average of (actual – forecast) | Catching systematic over or under-forecasting | Direction only, not size; pair it with MAPE |
For most ecommerce catalogs, WAPE plus bias is the honest pairing: WAPE weights each SKU by its volume so your big sellers carry the weight they should, and it survives the zero-demand periods that break MAPE.
What’s a good forecast accuracy?
There’s no universal target, because a good number depends on how spiky the product is and how far up you aggregate. Steady, high-volume SKUs can hit single-digit MAPE, while new or low-volume items routinely run 30% or more, and category-level accuracy always beats single-SKU because the errors offset. Treat these as directional bands as of mid-2026, not hard rules:
Table: how to read a MAPE (as of mid-2026)
| MAPE | Read as | Note |
| 10% or below | Highly accurate | Realistic for steady, high-volume SKUs |
| 10–20% | Good | Typical for most catalog items |
| 20–50% | Reasonable | Common for spiky or lower-volume SKUs |
| Above 50% | Poor | Re-pick the method or forecast at a coarser grain |
If you’d rather report accuracy than error, flip it: forecast accuracy equals 1 minus MAPE (or 1 minus WAPE). A 12% WAPE is an 88% accuracy, which tends to land better with a team than talking about error. Whichever you show, watch the trend as closely as the level, because a number drifting the wrong way month over month matters more than where it sits today.
Track your forecast accuracy over time
Scoring one SKU in a scratch sheet is easy; doing it for the whole catalog every month is the part that slips.
The Merchant Sheets Inventory Forecasting template tracks MAPE and bias per SKU as each month’s actuals land, flags the items drifting off, and feeds the corrected forecast straight into a safety stock level, a reorder point, and a purchase-order date and quantity.
It turns a one-time forecast-error check into a number you watch, so a forecast that starts slipping shows up before it costs you a stockout or ties up cash.
Frequently asked questions
How do you calculate forecast error in Excel?
Forecast error for a period is actual demand minus forecast, entered as a simple formula like =B2-C2. From that one column you build the rest: wrap it in =ABS() for the absolute error, divide the absolute error by actual for the percentage error, then average those columns to get MAD, MAPE, and bias.
What is the formula for MAPE?
MAPE is the average of the absolute percentage errors: for each period take |actual minus forecast| divided by actual, then average across all periods. In Excel that’s =AVERAGE of a helper column of APEs, or the array formula =AVERAGE(ABS(actual range minus forecast range)/actual range).
What's the difference between qualitative and quantitative forecasting?
Quantitative forecasting projects future demand from numerical history using formulas, so it’s objective and repeatable but blind to anything not already in the data. Qualitative forecasting uses human judgment, such as expert opinion or customer surveys, and fits new products or market shifts where clean history doesn’t exist yet. The best forecasts combine the two.
What is a good MAPE?
As a rough guide, a MAPE of 10% or below is highly accurate, 10–20% is good, 20–50% is reasonable, and above 50% is poor, though the realistic target depends on the product. Steady, high-volume SKUs hit single digits while spiky or low-volume ones run much higher, so benchmark against your own trend rather than a universal number.
What's the difference between MAPE and MAD?
MAPE is a percentage and MAD is in units, so they answer different questions. MAD (mean absolute error) is the average miss in units and is ideal for a single SKU, while MAPE expresses that miss as a percentage of demand, which is easier to compare and communicate but distorts on low-volume items. For a whole catalog, WAPE is usually the better choice than either.
How do you calculate forecast bias in Excel?
Bias is the average of the signed forecast error, =AVERAGE of the actual-minus-forecast column, without taking absolute values. A positive result means you’re under-forecasting (demand keeps beating the forecast) and a negative result means you’re over-forecasting. Because it keeps the sign, bias shows direction, so pair it with MAPE or WAPE to see size and direction together.
Why can't you use MAPE with zero demand?
MAPE divides each error by actual demand, so a period with zero demand makes the calculation divide by zero and return an error. It also inflates sharply when demand is very low, since a small unit miss becomes a huge percentage. For intermittent or low-volume SKUs, use WAPE or MAD instead, which don’t break at zero.
