
Key takeaways
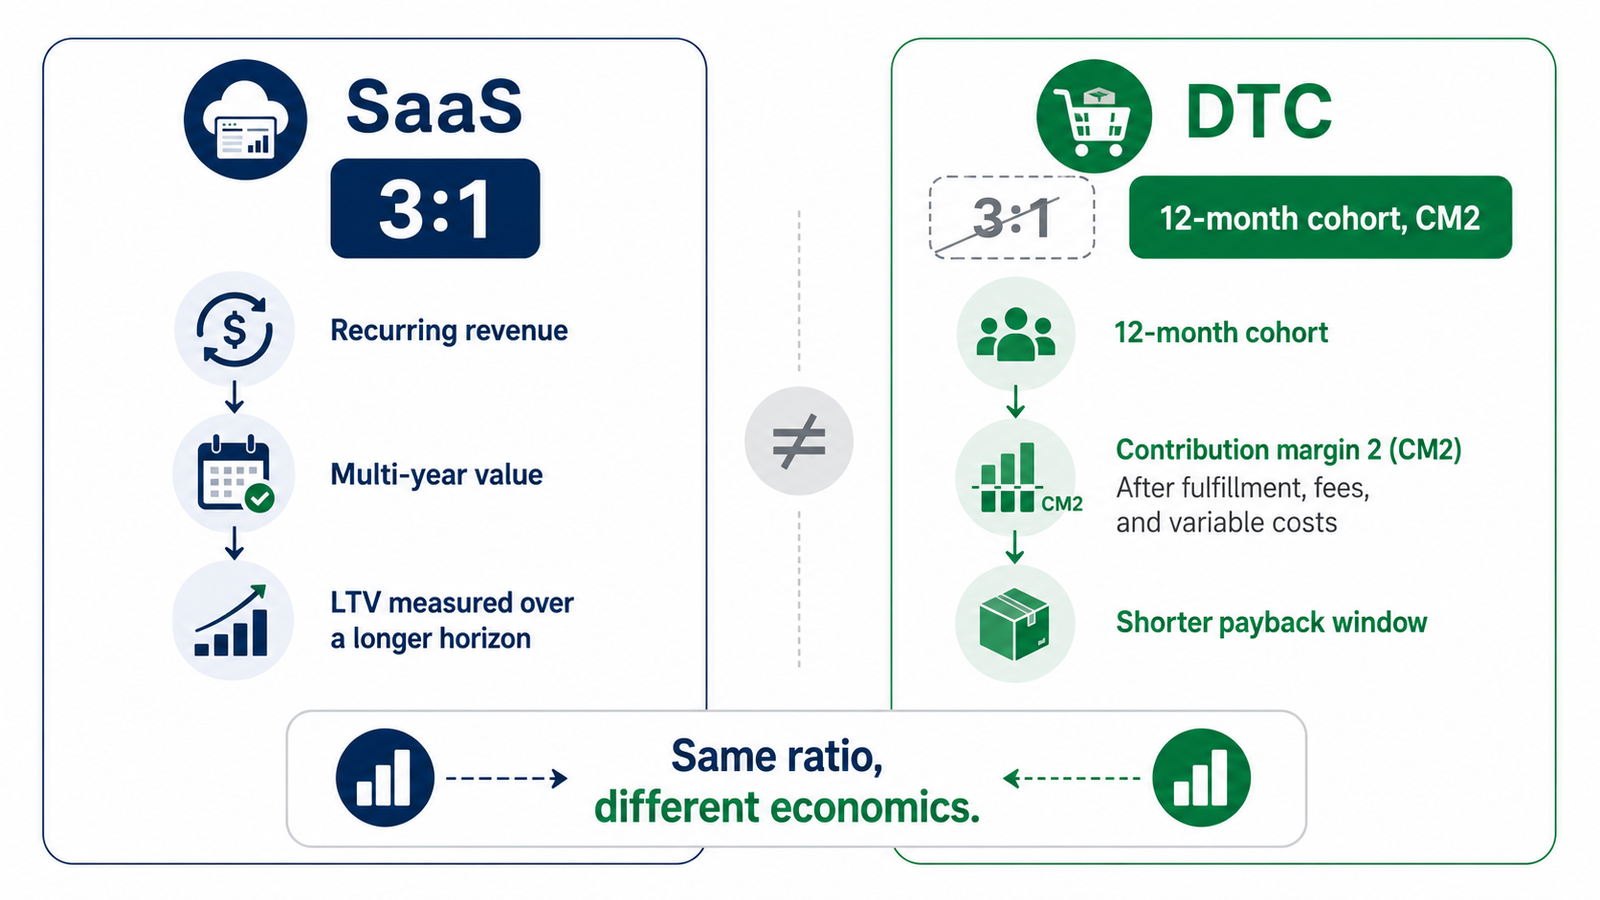
- The 3:1 benchmark comes from SaaS, where lifetime value is years of recurring revenue. DTC revenue is transactional and decays, so the number doesn’t translate.
- The DTC formula is one line: 12-month cohort contribution margin (CM2) per customer, divided by blended, cohort-matched customer acquisition cost.
- A healthy DTC LTV:CAC sits between roughly 2.5:1 and 4:1 on that CM2 basis. Below the band you’re underwater on payback; above it you’re usually under-spending on growth.
- Building the ratio on revenue instead of contribution overstates it by 50–70%. The dashboard can read 4:1 while the bank reads 2.4:1.
- Read the ratio alongside CAC payback period. Two brands at 3:1 can have very different cash profiles depending on how fast the money comes back.
The 3:1 LTV:CAC rule shows up in every DTC board deck and pitch memo. It came from software, where a customer signs up and pays every month for years. Your customers buy a candle, come back once or twice, and move on.
The ratio still earns its place for a direct-to-consumer (DTC) brand, but the SaaS benchmark stapled to it was built on economics you don’t have.
Here’s the version that holds up: lifetime value measured as the contribution a customer leaves over a real 12-month window, divided by what you paid to acquire them.
This guide walks through the formula, the four ways to calculate lifetime value and the one worth using, the benchmark band that fits DTC, and why you read the ratio next to payback period rather than on its own.
What is the LTV:CAC ratio?
LTV:CAC is the ratio of customer lifetime value (LTV) to customer acquisition cost (CAC). It answers one question: for every dollar you spend acquiring a customer, how many dollars of value come back over the time you keep them?
A ratio of 3:1 means a customer who cost $30 to acquire returns $90 of value; a ratio of 1:1 means you broke even on acquisition and nothing more.
The ratio is scale-independent, so it reads the same whether your CAC is $20 or $200. That’s what makes it useful for comparing periods, channels, and brands. The entire game sits in the numerator: what you decide to count as “value” changes the answer completely, and it’s where most DTC brands get the number wrong.
The LTV:CAC formula for DTC
The base formula is simple: LTV:CAC = LTV ÷ CAC. The work is defining each side so the result reflects cash you can really spend.
| DTC LTV:CAC = 12-month cohort CM2 per customer ÷ blended, cohort-matched CAC |
On the numerator, use contribution margin, not revenue. Your contribution margin is what a sale leaves after the cost of making and delivering it — for the fuller breakdown, see our guide to contribution margin.
The rung to use here is CM2: net revenue minus product cost (COGS), fulfillment, shipping, payment fees, and a returns reserve. Sum each customer’s CM2 across their first 12 months, then average across the cohort. That’s your LTV.
On the denominator, use blended CAC: total marketing spend for a period divided by the new customers it brought in. Match it to the cohort, so you’re dividing the same month’s acquisition cost into the same month’s customers.
Using this month’s CAC against last year’s LTV produces a flattering number that falls apart the moment ad costs rise.
A worked example makes the gap between revenue and contribution obvious. Take the $40 candle from our contribution margin example, which carries $16 of variable cost, leaving 60% CM2, or $24 of contribution per order. Say the average customer in a cohort places 2.5 orders over 12 months, and blended CAC for that cohort is $25.
| What you count | 12-month value per customer | ÷ CAC | LTV:CAC |
| Revenue basis | 2.5 orders × $40 = $100 | $100 ÷ $25 | 4.0 : 1 |
| CM2 basis | 2.5 orders × $24 = $60 | $60 ÷ $25 | 2.4 : 1 |
Same customer, same cohort, two very different verdicts. The revenue version reads 4.0:1 and looks like a brand to pour money into. The contribution version reads 2.4:1, a hair under the healthy floor, because two-thirds of that “lifetime value” was never yours to keep. To run the same math on your own numbers:
- Pick an acquisition cohort: All the customers you acquired in a single month.
- Total their 12-month contribution: For each customer, add up CM2 across every order in their first 12 months, then average it across the cohort.
- Divide by that cohort’s blended CAC: Total marketing spend for the acquisition month, divided by new customers won.
- Note the payback: Track how many months cumulative CM2 took to cover the CAC — you’ll use it in a moment.
Why the 3:1 rule is wrong for DTC
The 3:1 benchmark traces to David Skok’s SaaS Metrics framework, published around 2010 and drawn from mature public software companies running at steady state. In that world, 3:1 is a reasonable floor. It rests on three properties that DTC doesn’t share.
The first is recurring revenue on a contract. A software customer at $100 a month for five years carries $6,000 of contractually defined lifetime value. A DTC customer’s value is a probability curve that decays after the first order, with no contract holding it up.
The second is margin structure. Software runs 75–90% gross margin with almost no cost to serve each additional user, so revenue converts cleanly into contribution. DTC runs 45–70% gross margin with real per-order variable cost — product, pick-and-pack, shipping, fees, returns — that repeats on every reorder.
The third is predictability. A contract anchors software behavior far into the future, so long-horizon LTV projections hold up. DTC repeat behavior gets fuzzy past 12 to 24 months as tastes shift and the product mix changes.
Put those together and a 3:1 ratio in software describes a healthier business than a 3:1 ratio in DTC, because the lifetime value underneath it isn’t the same measurement. The rule isn’t broken; it’s been lifted out of the context that made it true. For DTC, the defensible band is 2.5:1 to 4:1 on a 12-month CM2 cohort, which is where the rest of this guide lives.
The four ways to calculate LTV (and the one to use)
Before you can trust a ratio, you have to trust the lifetime value inside it. Four methods show up in DTC, and they hand back different answers from the same data.
| Method | How it’s built | Best for | The catch |
| 1. Naive LTV | AOV × purchase frequency × gross margin | Fast napkin check | Ignores churn and most variable cost; no time window |
| 2. Cohort historical | Actual value per acquisition cohort, measured to date | Honest reporting | Limited by how much order history you have |
| 3. Predicted / modeled | Retention curves projected forward (Lifetimely, Klaviyo CDP) | Forward planning | Noisy after any channel or offer change |
| 4. Cohort CM2 (12-month) | Summed CM2 per customer over 12 months, per cohort | Acquisition-budget decisions | Needs clean cost data to build |
Method four is the one to budget against, because it ties straight to the cash available to fund the next cohort. It’s also the version public DTC companies disclose in their cohort tables when they go public.
One trap sits underneath all of this. The “LTV” in Shopify, Triple Whale, and most attribution dashboards is lifetime revenue, with no COGS, fulfillment, fees, or returns removed. Treat that figure as your LTV and you’ll overstate the ratio by 50–70% and green-light acquisition spend the P&L can’t carry.
| The “LTV” in your dashboard is usually lifetime revenue. Run the ratio on contribution margin, or it will tell you to spend money you don’t have. |
LTV:CAC benchmarks for DTC
The healthy band for DTC is roughly 2.5:1 to 4:1 on a 12-month CM2 cohort. Below about 2.5:1, a cohort struggles to pay back its own acquisition cost before you’ve reinvested.
Above about 4:1 with flat customer counts, you’re usually leaving growth on the table and handing share to a competitor who’s willing to spend. The specific target shifts by vertical and by how you’re funded.
By vertical, the pattern follows margin and repeat behavior. Subscription and consumable categories run higher because the retention curve is steadier; transactional and lower-margin categories run lower. Treat these as directional 2026 ranges, not laws:
| Vertical | LTV:CAC (12-mo CM2) | Why it lands there |
| Apparel | 2.5 – 3.0 : 1 | Returns drag the numerator; watch net revenue |
| Beauty & skincare | 3.0 – 3.5 : 1 | Strong repeat, healthy margin |
| Supplements (subscription) | 3.5 – 4.5 : 1 | Predictable reorders lift the LTV curve |
| Food & beverage | 2.0 – 2.8 : 1 | Thin margins hold the ratio down |
| Home & lifestyle | 2.3 – 3.0 : 1 | Long gaps between purchases |
| Pet (subscription) | 3.5 – 4.5 : 1 | Replenishment keeps cohorts alive |
By funding stage, the target moves with your access to capital. A bootstrapped brand needs a tighter ratio and faster payback because it funds growth from its own cash; a venture-backed brand can carry a longer payback while cohorts mature.
| Stage | Target LTV:CAC | CAC payback | Why |
| Bootstrapped | 3:1 and up | Under 6 months | No outside capital to bridge the payback gap |
| Seed / Series A | 2.5:1 and up | Under 12 months | Growth capital covers a longer runway to payback |
| Growth / Series B+ | 2.5 – 4:1 | Under 12 months | Efficiency at scale; overspending surfaces later |
| Mature / profitable | 3 – 4:1 | Under 12 months | Below 3:1 under-prices the brand; above 4:1 cedes share |
LTV:CAC vs CAC payback period
LTV:CAC and CAC payback period run on the same inputs and answer different questions. The ratio measures efficiency: how much value a customer returns over the window. Payback period measures speed: how many months until cumulative contribution covers the acquisition cost. You need both, because a strong ratio can still hide a cash problem.
Go back to the candle cohort. At $24 of CM2 per order and a $25 CAC, the first order almost covers acquisition, and the second order clears it well inside three months. That’s a 2.4:1 ratio — borderline on efficiency — paired with a fast, healthy payback.
The cash comes back quickly enough to recycle into the next cohort, which matters more day to day than the headline ratio.
Now picture two brands both reporting 3:1. One recovers its CAC in four months; the other takes fourteen. The first can keep reinvesting and compounding; the second is one slow season away from a working-capital squeeze.
The full read on a DTC brand is three-part: hit the 2.5:1 to 4:1 band, keep CAC payback period under about 12 months (under 6 if you’re bootstrapped), and grow customer count quarter over quarter. Benchmark the denominator against typical CAC by marketing channel so you know whether the cost side is even competitive.
How to improve your LTV:CAC
Four levers lift the numerator and four pull down the denominator. The brands that move the ratio work both sides at once rather than chasing a single number.
On the lifetime-value side:
- Raise AOV: Bundles, volume tiers, and post-purchase upsells add contribution to the same acquired customer.
- Lift repeat rate: Email and SMS flows, a strong second-order offer, and better post-purchase timing bring more customers back. See how often customers come back for the benchmark to beat.
- Cut returns: Every returned order pulls straight out of the numerator, so accurate sizing, photography, and expectations pay back directly.
- Grow subscription mix: Moving buyers onto subscription steadies the curve, and lower subscription churn is often the single biggest LTV lever for consumables.
On the acquisition-cost side:
- Rebalance channel mix: Shift budget toward the channels returning customers at the lowest cost, and re-check the split each quarter.
- Invest in creative: Creative drives most of the variance in paid CPMs and conversion, so a steady pipeline of new ads keeps CAC down.
- Improve conversion rate: Better product pages and checkout convert the traffic you already pay for, lowering effective CAC.
- Build organic and referral: Word-of-mouth and owned audiences lower blended CAC over time as the paid share shrinks.
Build your LTV:CAC on your own cohorts
A benchmark band is a starting point. The number that runs your acquisition budget is the one built from your orders, your margins, and your real retention curve.
The CAC/LTV Cohort Analyzer builds your 12-month CM2 cohort curve and the LTV:CAC ratio straight from your sales, with CAC payback period sitting right beside it, so you set the target off your numbers instead of a rule of thumb from another industry. See where your cohorts really stand.
Frequently asked questions
What is a good LTV:CAC ratio for ecommerce?
For DTC ecommerce, a healthy ratio sits between about 2.5:1 and 4:1, measured as 12-month cohort contribution margin (CM2) over blended CAC. Below 2.5:1 the cohort struggles to pay back its acquisition cost; above 4:1 with flat growth, you’re likely under-spending. The right target depends on your vertical, margin, and funding stage.
Is 3:1 LTV:CAC good?
It’s a fine landing spot for DTC if it’s built on contribution margin, not revenue. The problem is the 3:1 rule was imported from SaaS, where lifetime value is years of recurring revenue. Applied to a revenue-based DTC number, 3:1 often masks a real ratio closer to 1.5:1 once product, fulfillment, and returns come out.
Should LTV be based on revenue or profit?
Contribution margin, every time. Revenue-based LTV ignores COGS, fulfillment, fees, and returns, which overstates customer value by 50–70% in a typical DTC business. The dollars that matter for acquisition are the ones left over to pay back CAC and fund fixed costs, and that’s CM2.
What's the difference between LTV:CAC and CAC payback period?
LTV:CAC is a ratio that measures efficiency over the lifetime window. CAC payback period is a duration that measures how fast the cash comes back. Two brands can share a 3:1 ratio while one recovers CAC in four months and the other in fourteen. For cash management, payback is often the more actionable of the two.
How do returns affect LTV:CAC?
Returns hit the numerator without touching the denominator: net revenue per customer falls while the acquisition cost stays fixed. In high-return categories like apparel, honestly modeling returns can move a reported 3:1 down to 2.2–2.5:1. Calculate cohort LTV on net revenue after refunds, not gross sales.
Can a high LTV:CAC ratio be bad?
Yes. A ratio of 5:1 or 6:1 with flat customer counts usually signals under-investment in acquisition. If a competitor runs 3:1 and grows faster, they’re capturing customers you could afford. Treat LTV:CAC as an efficiency reading; health is the combination of hitting the band, keeping payback short, and still growing.
