
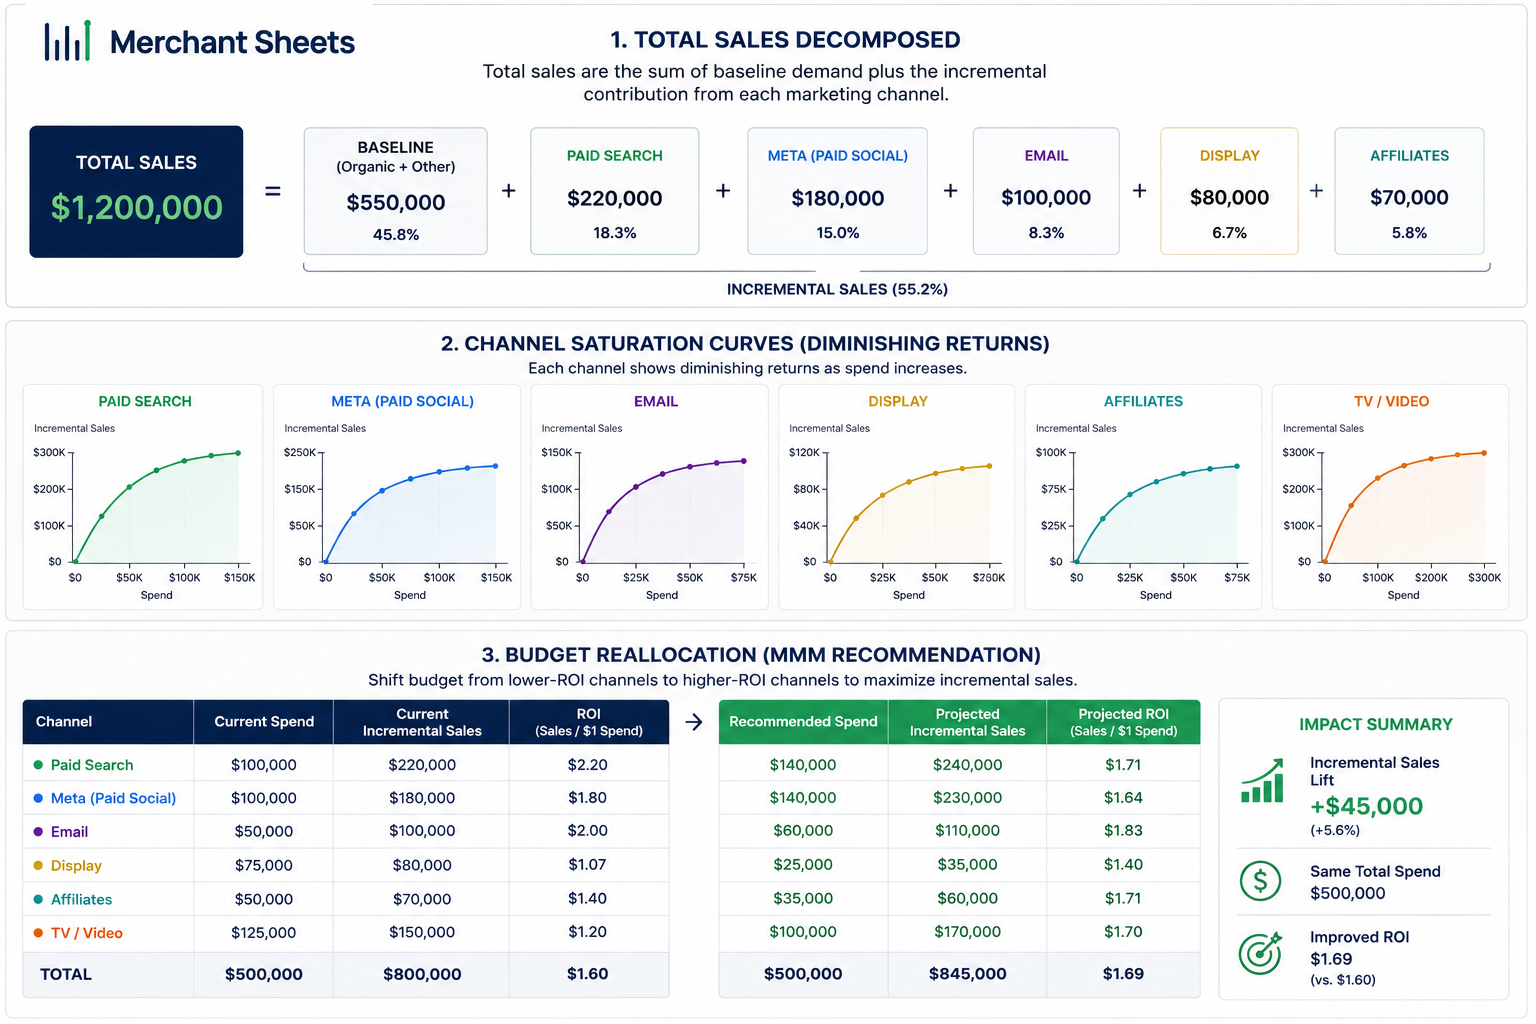
Your ad platforms each claim credit for the same sale. Add up what Meta, Google, and TikTok say they drove, and the total lands well above your actual revenue. Since Apple’s tracking changes, even those inflated numbers went blurry.
Marketing mix modeling takes the opposite route: it ignores the individual click, looks at spend and sales in aggregate, and works out what each channel truly added.
This guide covers what marketing mix modeling (MMM) is, why DTC brands are back on it after a decade away, and how to put its core logic to work this quarter, well before you can run the full statistical version.
Key takeaways
- Marketing mix modeling (MMM) is a statistical method that separates baseline demand, the sales you’d make anyway, from the incremental sales each marketing channel drove, using aggregated data with no user-level tracking.
- MMM works on spend-and-sales time series, so privacy changes like Apple’s App Tracking Transparency and the loss of third-party cookies don’t degrade it. That’s why a method most DTC brands shelved a decade ago is back.
- A full MMM is a regression, increasingly Bayesian, that usually needs 18–24 months of weekly data and either a data scientist or an open-source framework such as Meta’s Robyn or Google’s Meridian.
- You can apply MMM’s core logic in a spreadsheet with 12 months of your own channel data: score each channel’s efficiency, model its diminishing returns, and reallocate budget, without fitting the regression.
- The output that pays off isn’t a ROAS figure; it’s the reallocation that lifts blended return at the same total spend, because the next dollar into a saturated channel is worth less than the last.
What is marketing mix modeling?
Marketing mix modeling is a statistical method that estimates how much each marketing channel and outside factor contributed to sales over a period. It separates the baseline demand you’d have earned anyway from the incremental lift your spend produced, working from aggregated time-series data rather than tracking individual shoppers.
The technique is old. Consumer-goods giants have run some form of it since the 1960s, when weekly sales and media spend were the only data on hand. What changed is who needs it. Media mix modeling, the same method under a different name, used to belong to brands big enough to keep a team of econometricians on staff.
Today it’s the measurement a mid-sized DTC brand reaches for when its dashboards stop reconciling.
At its core, MMM answers one question: if you hadn’t run that campaign, how many of those sales would you have made anyway? Everything else follows from splitting the two apart.
Why is MMM back for DTC brands?
MMM is back because the tracking it competes with broke. Apple’s App Tracking Transparency, the decline of third-party cookies, and tighter privacy rules cut the share of purchases you can trace to a single click. MMM runs on aggregate data, so none of that touches it.
For a decade, DTC ran on click-based attribution. A shopper clicked a Meta ad, bought two days later, and Meta booked the sale. It felt precise, and it was cheap. Then App Tracking Transparency (iOS 14.5, 2021) let users opt out, and most did.
Third-party cookies fell away across Safari and Firefox. By 2026, practitioner estimates put the share of purchases you can tie to a known user at roughly 30–60%, down from the 90%-plus of the cookie era (directional, as of early 2026).
That gap is why measurement teams changed their minds. In eMarketer’s 2025 reporting, a larger share of US marketers rated MMM their most reliable measurement method than said the same of multi-touch attribution. A method many brands had written off came back because it works inside privacy limits by design.
MMM, attribution, and incrementality: what’s the difference?
Attribution, MMM, and incrementality answer three different questions. Attribution assigns credit for a sale to the touchpoints along the way using user-level data. MMM estimates each channel’s contribution from the top down, out of aggregate spend and sales. Incrementality testing runs an experiment to prove one channel caused sales. Mature measurement uses all three together.
Table 1: How the three measurement methods compare.
| Method | What it measures | Data it needs | Answers best |
| MMM | Each channel’s aggregate contribution to sales | Years of weekly spend and sales, top-down | How should I split the total budget? |
| Multi-touch attribution (MTA) | Credit for a sale across a user’s touchpoints | User-level click and conversion tracking | Which touchpoints did this buyer see? |
| Incrementality testing | The causal lift from one channel | A controlled geo or holdout experiment | Did this channel cause the sales? |
Each has a weak spot. MMM is coarse and slow, so it won’t tell you whether last week’s creative worked. Attribution is granular but leans on the user-level signal that privacy rules eroded. Experiments are the gold standard for causation, yet you can only run so many at once.
The practical stance: let MMM set the budget, let experiments calibrate it, and let attribution guide the day-to-day.
The concepts that make MMM work
Four ideas do the heavy lifting inside any marketing mix model. Read them once and the rest of the method reads clearly.
Table 2: The core building blocks of a marketing mix model.
| Concept | What it means |
| Baseline | The sales you’d make with zero marketing, driven by brand equity, season, and demand. MMM strips this out first. |
| Incremental | The extra sales a channel drove on top of baseline. This is the number that justifies the spend. |
| Adstock (carryover) | Advertising keeps working after the week you paid for it. Adstock spreads a burst of spend across the weeks that follow. |
| Saturation | Each extra dollar in a channel buys less than the last, drawn as a curve that flattens as spend climbs. |
| Coefficient | The weight the model assigns a channel: how much sales move per dollar, once baseline and carryover are accounted for. |
What does a full marketing mix model take?
A full MMM takes three things most sub-$5M brands don’t have yet: roughly 18–24 months of clean weekly data across spend, price, and promotions; either a data scientist or an open-source modeling framework; and four to eight weeks to build and validate the first model.
The data is the real gate. A regression needs enough history to separate a channel’s effect from season, price, and plain momentum, and that means two-plus years of weekly numbers, enough to see through the noise. Then you need something to fit the model.
Meta’s Robyn uses ridge regression; Google’s Meridian and PyMC-Marketing take a Bayesian approach; a handful of paid platforms wrap the same math in a dashboard. Meta built Robyn in part because MMM used to be affordable only for the biggest advertisers, and it wanted to widen the door.
So here’s the honest read. For a brand without two clean years of data and someone to run the model, a full MMM is a project for later this year or next. That still leaves a gap between the method you’re building toward and the budget decision you face on Monday. A spreadsheet closes it.
A practical middle path: the channel mix model
You don’t need the regression to use MMM’s logic. Three moves carry most of the value: score each channel’s efficiency, model how fast it saturates, and shift budget toward the channels with room to grow. All three fit in a spreadsheet built on 12 months of your own channel data.
What you’re building swaps the fitted regression for an elasticity curve, so treat the output as a directional guide and validate the big moves before you commit. Here’s the build, in the order you’d set it up:
- Set your business constants: Enter blended AOV, gross margin, repeat rate, and your target MER and CAC.
- List your channels: Give each one a target ROAS and an elasticity assumption from 0 to 1.
- Paste 12 months of performance: One row per channel per month: spend, impressions, clicks, sessions, orders, revenue, and new customers.
- Read the scorecard: Let the model compute each channel’s efficiency metrics and rank them into tiers.
- Model diminishing returns: Set an elasticity per channel so the projection knows where extra spend stops paying.
- Reallocate the budget: Dial each channel’s share and watch blended ROAS, MER, and CAC move current versus proposed.
- Check integrity and act: Confirm the numbers hold, then move the money.
How do you score each channel?
You can’t reallocate a budget across channels you can’t compare, and raw ROAS alone won’t rank them. A channel can post a strong ROAS while acquiring almost no new customers, or a soft ROAS while carrying your retention. Scoring fixes that by putting every channel on the same yardstick.
The scorecard computes the full efficiency stack per channel: CPM, CPC, conversion rate, cost per acquisition, ROAS (revenue divided by ad spend), CAC (what it costs to acquire one paying customer), and contribution per order. It then rolls the three that matter into one composite score.
Contribution per order = AOV × gross margin − cost per acquisition
The composite weights ROAS at 50%, CAC at 30%, and contribution at 20%, then sorts each channel into a tier from A to D with a recommended action: SCALE UP, MAINTAIN, OPTIMIZE, or CUT. Read against benchmarks like average CAC by channel, the tiers turn a wall of metrics into a short list of moves.
A low-competition search channel posting a 4.5x ROAS and a $22 CAC lands in tier A and earns more budget. A high-variance influencer line running a 2x ROAS and a $95 CAC lands in tier D, where the call is to fix the creative or cut it.
Why does diminishing returns decide where you spend?
Because the next dollar into a channel rarely earns what the last one did. A channel that returns 4x at $5,000 a month might return 2x at $15,000 once you’ve exhausted its best audiences. Modeling that curve is what keeps a reallocation from chasing a winner off a cliff.
Each channel gets an elasticity input from 0 to 1. At 0, revenue scales dollar for dollar with spend. At 1, the channel is saturated and extra spend does nothing. The projection runs off one formula:
Expected revenue = current revenue × (new spend ÷ current spend) ^ (1 − elasticity)
Starting ranges help you calibrate before you have your own read: paid search tends to sit near 0.20–0.35, paid social near 0.40–0.55, and list- or index-bound channels like email and SEO near 0.60–0.80. Tune each one from your own history, since a channel’s curve is specific to your audience and creative.
The lesson diminishing returns teaches is simple: a channel’s ROAS is a snapshot at today’s spend, and it says little about the return waiting at triple the budget.
The elasticity curve tells you which channel still has headroom, so you move budget toward it instead of doubling down on a winner that’s already tapped out.
What does reallocating the budget do?
The allocator is where the work pays off. Set your total monthly budget, dial each channel’s share, and the model projects expected revenue, blended ROAS, blended MER (total revenue divided by total ad spend), and blended CAC, showing current values beside proposed ones.
Because the elasticity curves sit underneath, the projection stays honest. Pour the whole budget into your best channel and the model shows the return flattening as that channel saturates, rather than compounding forever. The win you’re looking for is a reallocation that lifts blended return at the same total spend.
Gut-check the shift before you commit. Hold it against your break-even ROAS so no channel gets funded below the floor, and against MER benchmarks for your vertical so the blended number stays defensible
A reallocation that looks sharp in isolation can still miss if it ignores the repeat revenue that shows up in your LTV:CAC, so weigh retention channels on the profit they compound over time, which first-order ROAS understates.
These are the same KPIs you’re already tracking, viewed through the lens of where the next dollar goes.
How do you use it, and when do you graduate to a full MMM?
Run it on a monthly cadence. Re-paste the latest month, recheck the tiers, and recalibrate a channel’s elasticity when its response shifts. Before you commit real budget to a big reallocation, validate it with a cheap geo or holdout test, the same experiments that calibrate a real model.
Feed the result into how you build a financial model so the reallocation lands in your P&L, and pressure-test the downside with scenario planning before you pull spend from a channel that’s carrying cash flow.
The spreadsheet is a bridge, and at some point you’ll be ready to cross it. You’ll know it’s time when:
- The data is there: You have roughly two years of clean weekly data across spend, price, and promotions.
- The spend justifies it: Your marketing budget is large enough that a few points of accuracy pays for the model.
- The questions got harder: You’re asking about adstock, saturation curves, and cross-channel effects the sheet only approximates.
Where to start
A full marketing mix model is months and a data scientist away, and you still have to decide where next month’s budget goes.
The Marketing Channel Mix Model gets you the working half now: paste twelve months of channel data, and it scores every channel, models diminishing returns with an elasticity curve, and shows what reallocating budget does to your blended ROAS and CAC before you move a dollar.
Frequently asked questions
What is marketing mix modeling in simple terms?
Marketing mix modeling is a way to measure how much each marketing channel added to sales by studying spend and revenue in aggregate, instead of tracking individual shoppers. It separates the sales you’d have made anyway from the extra sales your advertising drove.
What’s the difference between MMM and attribution?
MMM works top-down from aggregate spend and sales to estimate each channel’s contribution, while attribution works bottom-up from user-level clicks to assign credit for a specific sale. MMM survives privacy changes because it needs no user tracking; attribution has weakened as that tracking eroded.
How much data do you need for marketing mix modeling?
A full MMM typically needs 18–24 months of weekly data, and two to three years is common, so the model can separate a channel’s effect from season, price, and momentum. You can start with less, but expect wider uncertainty and a bigger need for validation tests.
Can you do marketing mix modeling in Excel?
You can apply MMM’s logic in Excel or Google Sheets, though you can’t fit the full regression there without add-ins. A spreadsheet model scores each channel’s efficiency, applies an elasticity curve for diminishing returns, and reallocates budget, which covers the decisions most operators need before they’re ready for a fitted model.
Is MMM better than MTA?
Neither is strictly better; they answer different questions and work best together. MMM is stronger for budget-level decisions in a privacy-limited world, while multi-touch attribution is more granular for day-to-day optimization when the tracking data is reliable.
