
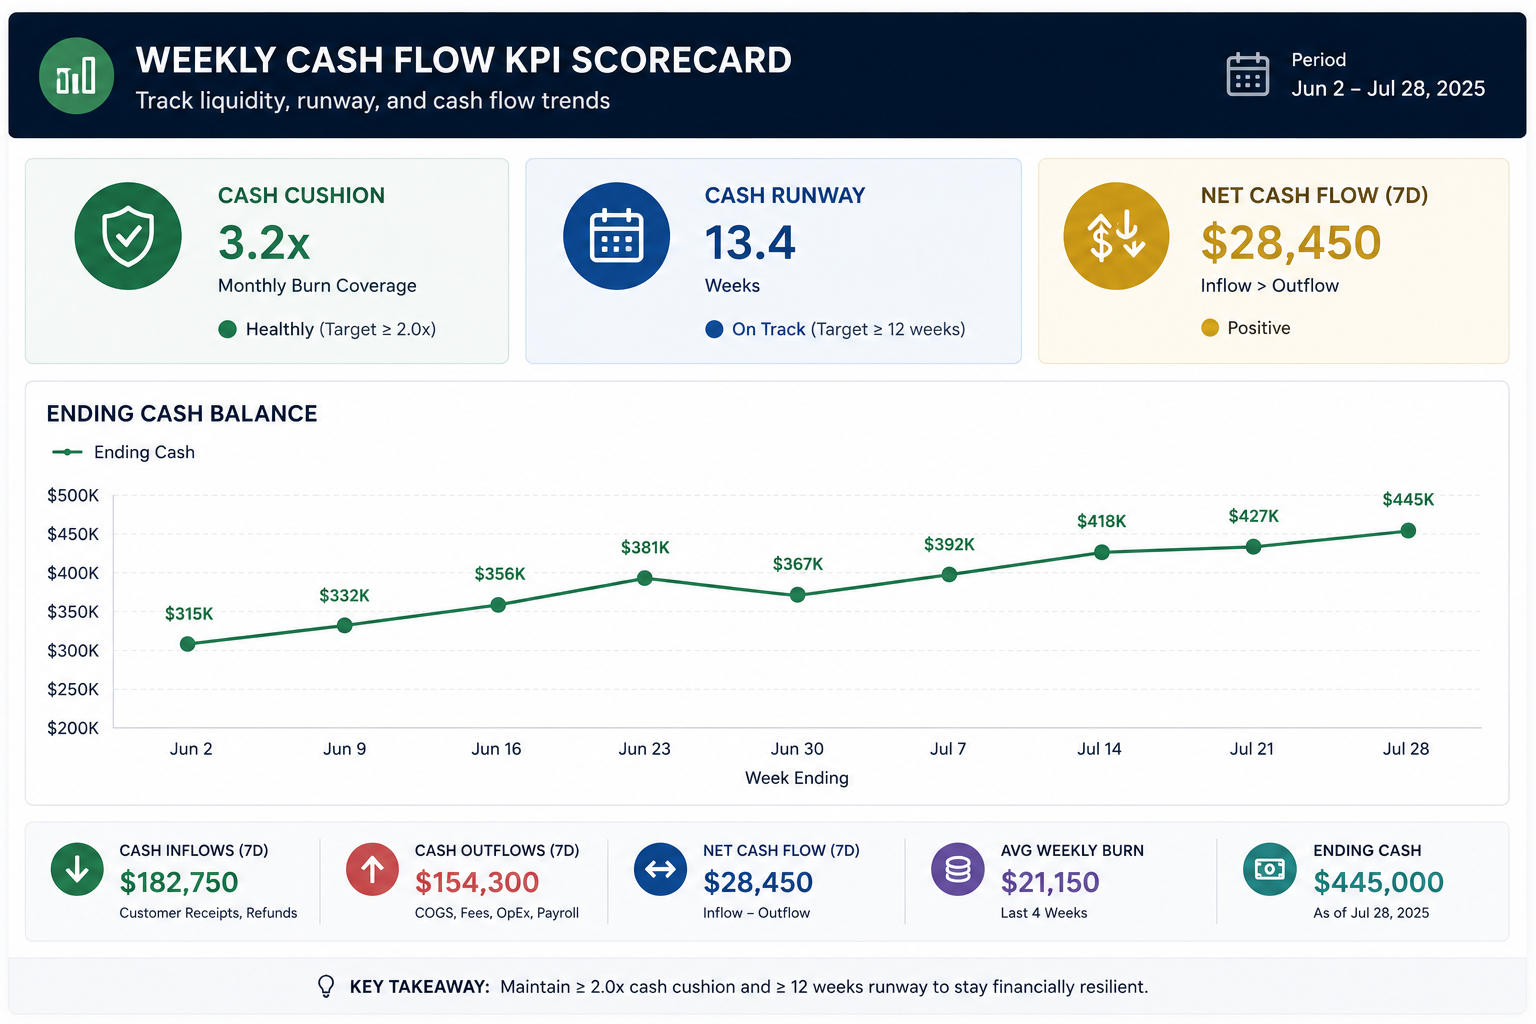
Profit is a monthly story. Cash is a weekly one. A handful of cash flow KPIs, read every Monday off a rolling forecast, tell you whether you can cover payroll, the next inventory drop, and this week’s ad spend — long before your accountant closes the month.
This guide names the cash numbers a DTC founder watches each week and shows how to read them.
Most of them come straight off a weekly cash forecast, and two of them are specific to ecommerce, where money you’ve “earned” can sit days away from your bank account.
What are weekly cash flow KPIs?
Weekly cash flow KPIs are the short list of cash-position metrics you check every week to see whether your business can pay its bills and keep growing. They’re read off a rolling cash forecast — a week-by-week projection of money in and money out — so they track when cash moves, rather than the accrual profit a P&L reports.
That timing difference is why they earn a weekly slot. Your monthly numbers can look fine while a mid-month inventory payment quietly drains the account. A cash flow KPI is any metric that measures the movement or level of cash: how much you hold, how fast it’s leaving, and how long it lasts.
For the monthly, profitability-side companion to these, see free cash flow margin; this page stays on the weekly cash view.
Why track cash weekly instead of monthly?
Because ecommerce cash is lumpy, and a month is long enough to hide a squeeze. Payment processors pay out on a lag, inventory is bought in large deposits, and ad spend goes out daily, so the cash low inside a month can sit well below where the month starts or ends.
A monthly close shows you the endpoints and misses the dip in between.
A weekly cadence catches that dip while you still have time to act — move a payment, pull from a credit line, or delay a PO. The numbers here assume you’re already running a 13-week cash flow forecast; if you’re not, start there, then come back and watch these KPIs on top of it.
The weekly cash flow KPIs at a glance
Eight numbers cover the weekly cash picture for most DTC brands. Here’s the set, what each one answers, and what a healthy reading looks like.
Table 1 — The weekly cash flow KPIs at a glance.
| KPI | What it answers | Healthy signal |
| Ending cash balance | How much cash you hold at the week’s close | Above your minimum-cash threshold, with room to spare |
| Net cash flow | Did you build or burn cash this week? | Positive, or negative only in planned inventory weeks |
| Cushion | How far above your cash floor are you? | Comfortably positive (OK status) |
| Cash runway | How long the cash lasts at the current pace | Three to six months or more (as of early 2026) |
| Net burn rate | How fast cash leaves, on a trailing average | Falling or near breakeven as you scale |
| Cash in transit | How much sold revenue hasn’t hit the bank yet | Stable and predictable against payout timing |
| Committed cash | Cash already promised to open POs and deposits | Covered by inflows before it comes due |
| Forecast variance | How close last week’s forecast was to actual | Small and stable — within a few percent |
Your cash position: ending balance, net cash flow, and cushion
Start every week with three numbers. The first is ending cash — the balance at the close of the week, which becomes next week’s opening balance. The second is net cash flow, the week’s cash in minus cash out, which tells you whether the business built or burned cash:
Net cash flow = weekly cash in − weekly cash out
The third is your cushion: ending cash minus the minimum-cash threshold you refuse to drop below. The threshold is your operating floor — enough to cover payroll and critical bills if a week comes in soft. A positive cushion means you’re clear; a negative one means you’ve breached the floor.
Cushion = ending cash − minimum-cash threshold
Take a week that opens at $85,000. Cash in is $50,000 (DTC payouts plus a wholesale collection); cash out is $64,000 (an inventory deposit, ad spend, payroll, and overhead). Net cash flow is −$14,000, so ending cash lands at $71,000. Against a $60,000 floor, the cushion is $11,000.
That’s a WATCH week — solvent, but worth a second look before the next PO goes out.
Table 2 — Status tiers, read against your minimum-cash threshold.
| Status | Ending cash vs threshold |
| OK | At or above 1.5× the threshold |
| WATCH | Between 1.0× and 1.5× the threshold |
| TIGHT | Between zero and 1.0× the threshold |
| BREACH | Below the threshold, or below zero |
How long will your cash last?
Two KPIs answer that. Net burn rate is how fast cash leaves, measured as average weekly cash out minus cash in. Cash runway turns that into time — how many weeks the current balance covers at that pace:
Cash runway (weeks) = current cash ÷ average weekly net burn
Measure burn on a trailing average, say the last four weeks, rather than a single week. One heavy week where a big inventory deposit went out isn’t your run rate; annualize it and you’ll scare yourself for no reason. Average across a month and the lumpy weeks smooth into a number you can plan against.
As of early 2026, most self-funded DTC brands want at least three to six months of runway on hand, and lenders and investors look for more. When runway tightens, it’s the earliest signal to act. Both of these are worth their own deeper look — see burn rate and runway for how to read them through a full cycle.
The DTC KPIs generic cash lists miss
Most cash-KPI lists were written for businesses that get paid when they invoice. Ecommerce doesn’t work that way, and two KPIs capture the difference. The first is cash in transit: revenue you’ve sold but haven’t received, because your processor pays on a delay.
As of early 2026, Shopify Payments settles about two business days after the sale, and Amazon disburses roughly every 14 days. A slice of last week’s “revenue” is still on its way, so your true cash position is lower than a sales report suggests.
| The trap: Your dashboard says the sale closed; your bank account disagrees. With Shopify paying out T+2 and Amazon about every 14 days, a chunk of recent revenue is still in transit. Track cash in transit, or your cash position will read high right up until a payment clears and it doesn’t. |
The second is committed cash: money already promised to open purchase orders and supplier deposits, even though it hasn’t left yet. A $71,000 balance with $40,000 of inventory deposits due next week is $31,000 of free cash.
Tracking committed cash keeps you from spending money that’s already spoken for, and it ties directly into net working capital, where inventory locks up the most cash in a growing store.
How accurate is your forecast? Track the variance
The KPI that keeps every other number honest is forecast-vs-actual variance: each week, compare the ending cash your forecast predicted against what landed in the bank.
Forecast variance = actual ending cash − forecast ending cash
A small, stable variance — within a few percent, week after week — means the forecast is reliable and you can act on it. A large or swinging variance means an input is off: a payout timing you mis-scheduled, an expense you forgot, a collection that slipped.
Chasing the variance down each week is what turns a cash forecast from a guess into a tool you trust with a payroll decision.
How to track them each week
The whole routine takes about fifteen minutes on a Monday morning, once the forecast is built.
- Update beginning cash: Drop in Monday’s actual bank balance so the week starts from truth.
- Refresh timing: Adjust any receipts and payments whose dates moved, so inflows and outflows land in the right week.
- Roll the window forward: Drop the week that closed and add a new week at the far end, so you always see a full quarter ahead.
- Read the scorecard: Check ending cash, cushion, runway, and the status flags, and note anything that shifted since last week.
Read every number off one sheet
These KPIs read off a weekly forecast, and rebuilding that forecast every Monday is the part that doesn’t scale.
The 13-Week Cash Flow Forecast tracks your cash in and cash out week by week, carries each closing balance into the next, and flags any week your cash dips below your floor — so ending cash, cushion, runway, and status all read straight off one sheet.
Get the template and run your Monday review in minutes.
Frequently asked questions
Which cash flow KPIs should I track weekly?
Track ending cash balance, net cash flow, and your cushion above a minimum-cash threshold every week, plus cash runway and net burn to see how long the money lasts. In ecommerce, add cash in transit and committed cash, since payout lags and inventory deposits distort your true position — that’s six to eight numbers, not a twenty-metric dashboard.
What’s a healthy cash runway for a DTC brand?
Most self-funded DTC brands aim for at least three to six months of runway, while lenders and investors typically want to see more before committing. The right number depends on how lumpy your inventory buys are and how predictable your sales are; a highly seasonal brand should hold a longer runway to cover the slow stretch. Date this against your own conditions, as benchmarks shift.
How often should I review my cash flow KPIs?
Weekly is the right cadence for a cash-intensive business like ecommerce, because payout timing and inventory payments move cash sharply within a month. A short Monday review catches a coming squeeze while you can still act on it, and a monthly-only look at cash often surfaces problems too late to fix cheaply.
Why can a profitable store still run low on cash?
Because profit and cash move on different clocks: a store can book a profitable month yet run low on cash if it paid for inventory weeks before selling it, or if processor payouts land after the bills are due. Profit measures what you earned; cash measures what’s in the bank right now, and inventory-heavy DTC brands routinely feel the gap.
