
Key takeaways
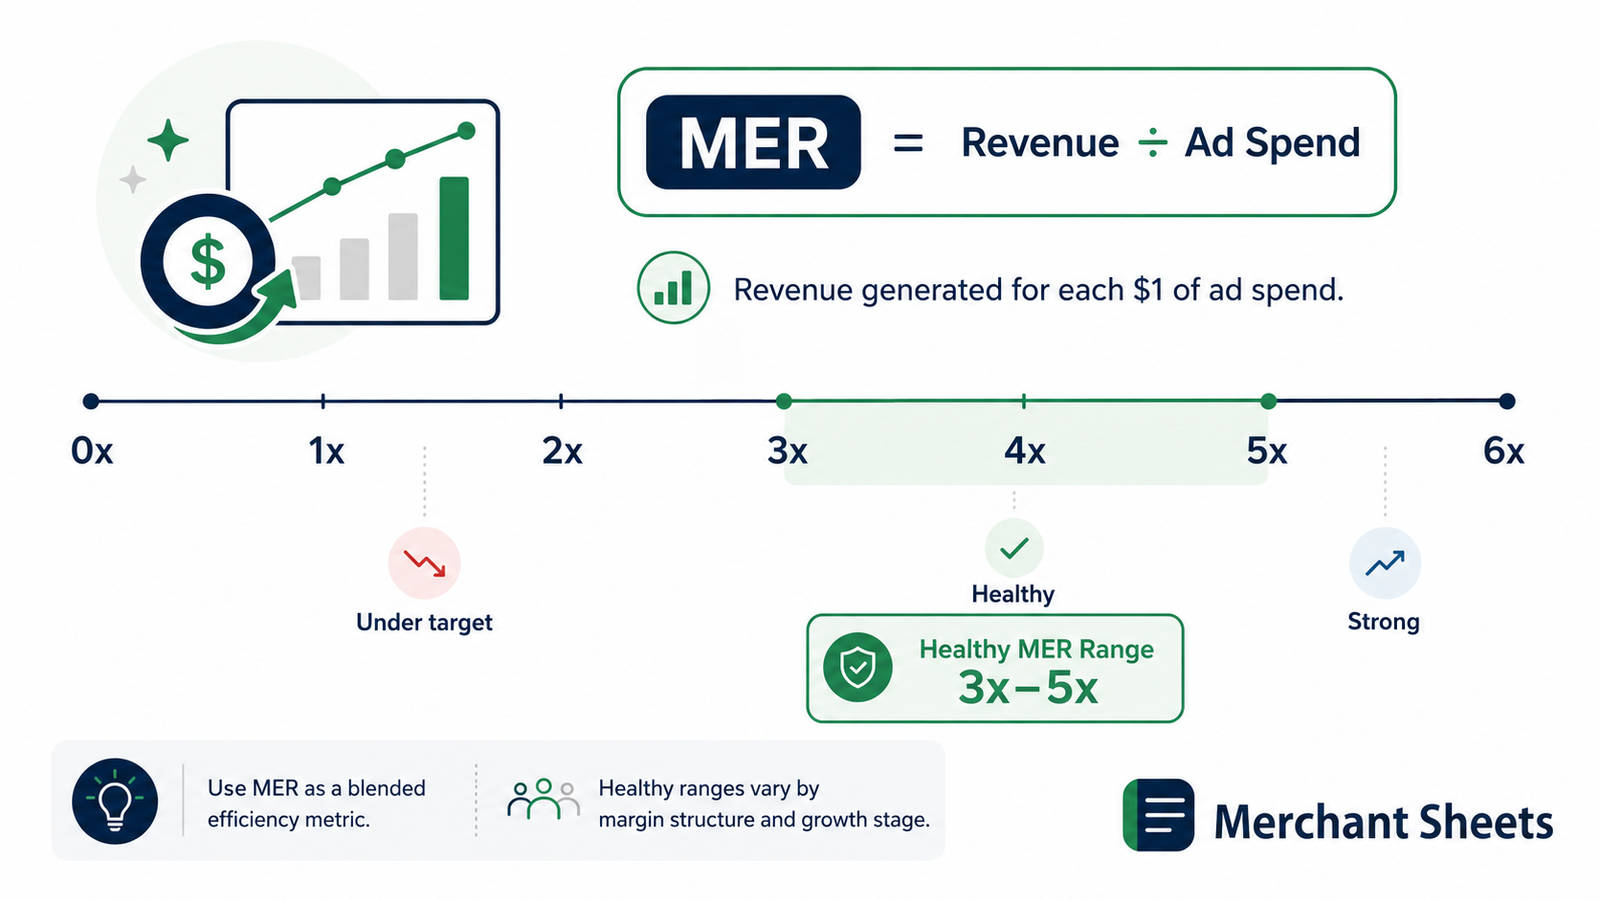
- A healthy blended MER runs 3–5x for most DTC brands in 2026, with mature subscription brands above 6x and early-stage brands often running lower on purpose.
- MER is total revenue divided by total marketing spend across every channel, sometimes called blended ROAS or eROAS.
- A vertical average mostly reflects contribution margin: high-margin categories like supplements and beauty run leaner, while apparel and furniture need a higher MER.
- Your real target is break-even MER, which equals 1 ÷ your contribution margin: a 40%-margin store breaks even at 2.5x, a 25%-margin store needs 4x.
- MER beats channel ROAS for judging efficiency because it uses real total revenue and spend, so attribution changes can’t inflate it.
A healthy marketing efficiency ratio runs 3–5x for most ecommerce brands, but the average for your vertical is mostly a stand-in for your margin. A skincare brand can thrive at 2.5x while a mattress brand loses money there. Here’s the MER benchmark by vertical, and the target that actually applies to you.
What’s the average MER by ecommerce vertical?
A healthy blended MER lands around 3–5x for most ecommerce brands in 2026. Mature brands, especially subscription models, often run above 6x, while early-stage brands frequently sit lower on purpose while they buy demand.
The right number for your store depends more on your margin and stage than on your industry.
MER, the marketing efficiency ratio, is total revenue divided by total marketing spend across every channel in a period. A store doing $500,000 in revenue on $125,000 of total ad and agency spend runs a 4x MER.
You’ll see it called blended ROAS or eROAS, since it measures the whole business rather than a single channel. The ranges below are current as of mid-2026.
MER benchmarks by vertical
There’s no single healthy MER, because the number tracks contribution margin far more than how well you run ads. High-margin, high-repeat categories like supplements and beauty can stay profitable at a leaner MER, since each sale leaves more room for acquisition.
Low-margin or return-heavy categories like apparel, food, and furniture need a higher MER to clear the same profit.
Table 1. Typical healthy MER by ecommerce vertical, as of mid-2026. The healthy number tracks contribution margin and return rates, and varies by stage.
| Ecommerce vertical | Typical healthy MER | Why |
| Supplements & health | 2.5–3.5x | High margin and high repeat let efficiency run leaner |
| Beauty & skincare | 2.5–3.5x | Strong margins absorb heavier acquisition spend |
| Digital products | 2.0–3.0x | Near-zero unit cost keeps break-even MER low |
| Pet | 3.0–4.5x | Mid-margin with strong repeat |
| Apparel & fashion | 3.5–5.0x | Margins compressed by high return rates |
| Food & beverage | 4.0–6.0x | Thin margins demand high efficiency |
| Home & furniture | 4.0–6.0x+ | Low margin and high fulfillment cost |
Read your number against your own margin, not the blended average. A 3x MER is comfortable for a supplement brand and underwater for a furniture brand.
As with any benchmark, the direction matters as much as the level: a MER sliding month over month means each marketing dollar is buying less revenue than it used to.
Returns are the quiet driver here. A 30% return rate in apparel doesn’t only cost the refund; it eats the shipping both ways and the handling, which drags contribution margin down and pushes the break-even MER up.
That’s why two brands with the same headline gross margin can need very different MERs to turn a profit.
MER by business stage
Vertical is only one axis. Where you are in the growth curve moves the target just as much, and often in the opposite direction from what you’d guess.
Early brands frequently run a lower MER on purpose, spending aggressively to win customers and build demand while they can. As a brand scales and repeat revenue compounds, more sales arrive without fresh ad spend, so the blended number climbs. Place yourself on both axes, your vertical and your stage, before you judge the figure.
Table 2. Typical MER target by revenue stage, as of mid-2026.
| Annual revenue stage | Typical MER target | What’s happening |
| $1M–$5M | 1.5–2.5x | Often run lean on purpose, buying demand and market share |
| $5M–$10M | 2.5–3.5x | Efficiency expected to improve as retention builds |
| $10M–$25M | 3.0–4.5x | Scale and repeat revenue lift the blended number |
| $25M–$100M+ | 3.5–6.0x+ | Mature brands, especially subscription, run the highest MER |
Your real target is break-even MER, not the industry average
Here’s the part most benchmark pages skip. The vertical average is a proxy for margin, and you can calculate your own target directly instead of borrowing someone else’s. Your break-even MER is 1 divided by your contribution margin, the profit left on a sale before marketing.
Run the numbers and the pattern is clear. At a 40% contribution margin you break even at a 2.5x MER, because every marketing dollar has to bring back $2.50 in revenue to cover itself. At a 25% margin you need 4x just to break even, and at a 60% margin you’re profitable down at 1.7x.
Everything above break-even is what funds your overhead and profit.
Table 3. Break-even MER from contribution margin (break-even MER = 1 ÷ contribution margin).
| Contribution margin | Break-even MER | Read |
| 25% | 4.0x | Every ad dollar must return $4 in revenue to break even |
| 40% | 2.5x | Break even at 2.5x; profit begins above it |
| 50% | 2.0x | Room to run acquisition harder |
| 60% | 1.7x | High-margin brands can profit at a low MER |
So derive your target from your own contribution margin first, then use the vertical number as a sanity check. This is the same math behind break-even ROAS; the difference is scope, since MER blends every channel while ROAS looks at one at a time.
Put it together with an example. A skincare brand at a 55% contribution margin has a break-even MER near 1.8x, so running at 3x leaves a healthy cushion for overhead and profit.
A furniture brand at 30% breaks even at 3.3x, so that same 3x MER is losing money on every order. Same MER, opposite verdict, because the margin underneath is different.
Why MER beats ROAS for this
Channel ROAS used to be trustworthy. After iOS 14 and the shift to privacy-first tracking, Meta and Google started over-crediting themselves and double-counting the same sale, so their reported ROAS no longer reconciles with the bank account. Two platforms can each claim the same order, and the totals stop adding up.
MER sidesteps all of that. It uses real total revenue over real total spend, so no amount of attribution noise can inflate it. Read MER as the business-level scoreboard and treat channel ROAS as a directional signal underneath it, useful for spotting which way to push budget but not for judging whether the whole engine is profitable.
When you do need to split credit across channels, that’s a job for marketing mix modeling, not the platform dashboards, and it pairs with watching your CAC by channel.
MER has one blind spot worth naming: it blends new and returning revenue, so a brand living off repeat customers can post a strong MER while new-customer acquisition quietly stalls. That’s why operators read MER next to CAC by channel and their repeat rate, not on its own.
See where your MER lands
A benchmark only helps if you can see your own number next to it. The ROAS / MER Tracker pulls your total revenue and spend into one view, tracks MER and blended CAC against a target you tie to your own margin, and flags when efficiency drifts, in Excel or Google Sheets.
Set your break-even MER, watch the trend, and stop guessing from the industry average. Get the template.
Frequently asked questions
What is a good MER for ecommerce?
A good ecommerce MER is 3–5x for most DTC brands, with high-margin categories healthy below that and low-margin ones needing more. The more precise answer is any MER above your break-even, which is 1 ÷ your contribution margin. Mature and subscription brands often run 6x or higher.
What’s the difference between MER and ROAS?
MER measures total revenue against total marketing spend across the whole business, while ROAS measures revenue against spend on a single channel or campaign. MER is blended and attribution-proof; ROAS is channel-specific and, since iOS 14, prone to over-crediting. Most operators track MER for profitability and ROAS for direction.
How do you calculate break-even MER?
Break-even MER equals 1 divided by your contribution margin. If your contribution margin is 40%, your break-even MER is 2.5x, meaning every marketing dollar must return $2.50 in revenue to cover itself. Anything above that figure contributes to overhead and profit.
Is a higher MER always better?
A higher MER means more efficient spend, but it isn’t always the goal. A brand deliberately running a lower MER to acquire customers and grow can be healthier than one starving acquisition to post a high number. Read MER against your margin, stage, retention, and cash rather than maximizing it in isolation.
What is a good MER by revenue stage?
Early-stage brands ($1–5M) often run 1.5–2.5x while buying growth, $5–10M brands run 2.5–3.5x, $10–25M brands run 3.0–4.5x, and $25M+ brands run 3.5–6.0x or higher as retention compounds. Efficiency is expected to rise as a brand scales.
