
Key takeaways
- ACoS (advertising cost of sale) is ad spend divided by ad-attributed sales; TACoS (total advertising cost of sale) divides the same ad spend by your total revenue, organic sales included.
- ACoS is tactical: it measures whether a campaign is efficient right now, and it’s the inverse of ROAS, so a 20% ACoS is a 5.0x ROAS.
- TACoS is strategic: it measures whether advertising is growing the whole business, and its direction over time tells you more than its absolute value.
- A falling TACoS on rising revenue means ads are lifting organic rank; a rising TACoS means organic is slipping, CPCs are climbing, or you’re leaning harder on ads to hold revenue.
- You don’t choose one. Optimize ACoS at the campaign level and watch TACoS at the business level. As of mid-2026 a healthy TACoS runs roughly 10-15%, lower for mature products and higher during a launch.
You already watch ACoS. So why does a campaign with a clean ACoS sometimes leave the business flat, while a pricier-looking one grows it? Because ACoS only counts the sales Amazon credits to your ads. TACoS counts all of them.
Get the split right and every decision gets clearer: you tune campaigns by ACoS week to week, then read TACoS month to month to see whether that work is compounding into organic sales or quietly renting them. Get it wrong and you’ll optimize a great-looking ACoS while the business stalls underneath it.
That’s the real ACoS vs TACoS question, and it’s about which number to use when.
What’s the difference between ACoS and TACoS?
ACoS (advertising cost of sale) is your ad spend divided by the sales Amazon attributes to those ads. TACoS (total advertising cost of sale) is the same ad spend divided by your total revenue, organic sales included. ACoS measures how efficient a campaign is; TACoS measures how much your whole business leans on ads.
The two share a top half and split on the bottom. Both start with the dollars you spent on Amazon ads. ACoS puts only ad-attributed revenue underneath, so it answers a narrow question: for the sales these ads drove, how much did they cost?
TACoS puts every dollar of revenue underneath, paid and organic, so it answers a wider one: across the whole business, how heavy is the ad bill? Same spend on top, different denominator below, and that one change is why the two numbers can tell different stories about the same account.
What is ACoS, and how do you calculate it?
ACoS is your ad spend divided by the revenue those ads generated, shown as a percentage. Amazon counts a sale as ad-driven when it lands inside the attribution window, usually 14 days after an ad click, so ACoS reflects paid performance and nothing else.
ACoS = ad spend ÷ ad sales × 100
Spend $200 on a campaign that returns $1,000 in ad sales and your ACoS is 20%. That’s the inverse of return on ad spend (ROAS): a 20% ACoS is a 5.0x ROAS, the same efficiency stated two ways. What ACoS won’t tell you on its own is whether that 20% is profitable. That depends on your margins, which is what your break-even ACoS sets, and it moves the moment a fee or a cost of goods changes.
Remember that Amazon’s referral and FBA fees come out of a sale before your ad budget does, so a healthy-looking ACoS can still sit above the line where you make money.
What is TACoS, and how do you calculate it?
TACoS is your total ad spend divided by your total revenue, paid and organic together, shown as a percentage. It reframes advertising as a share of the whole business rather than a share of the sales it directly drove.
TACoS = ad spend ÷ total revenue × 100
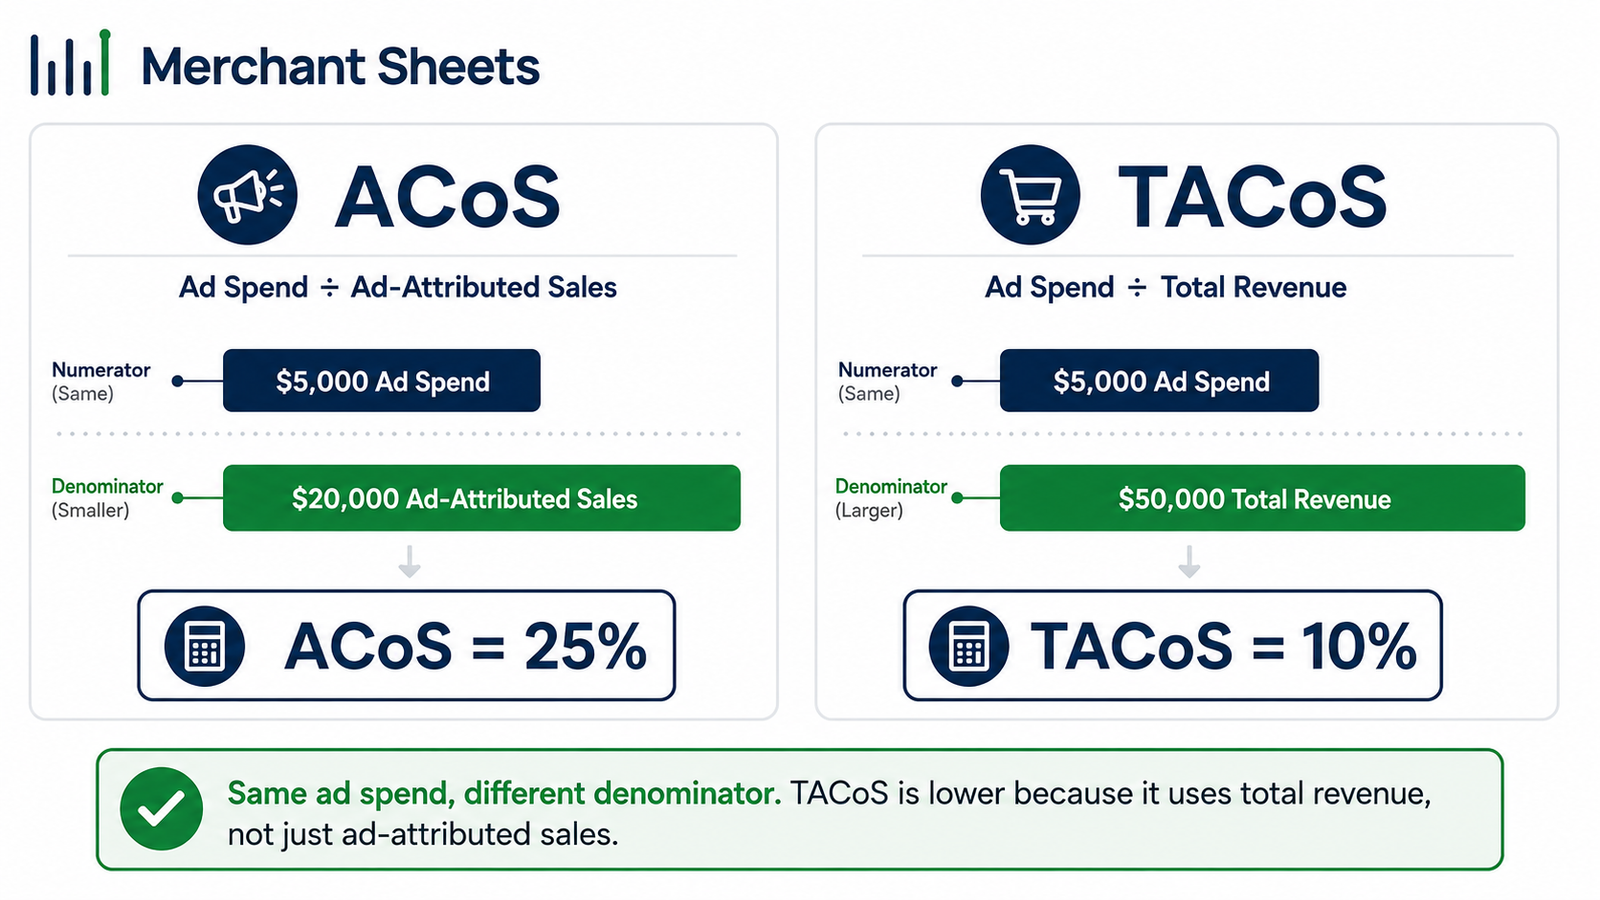
Take that same $200 of spend, but measure it against $2,000 in total revenue, including the organic sales your listing earned on its own. TACoS is 10%. Whenever organic sales exist, TACoS sits below ACoS, and the gap between them reads how much of the business runs without paying for the click.
A wide gap means organic is carrying most of the load; a narrow one means almost every sale is bought.
| Same ad spend, two denominators. ACoS divides it by ad sales to score the campaign; TACoS divides it by total revenue to score the business. |
ACoS vs TACoS, side by side
The two metrics do different jobs, so the useful move is to read them next to each other rather than pick a favorite.
How ACoS and TACoS compare
| ACoS | TACoS | |
| In the denominator | Ad-attributed sales only | Total revenue (paid + organic) |
| What it measures | Campaign efficiency | The business’s overall ad dependency |
| Question it answers | Are these ads efficient right now? | Is advertising growing the whole business? |
| Time horizon | Daily to weekly | Month over month |
| Best used for | Bidding, keywords, cutting wasted spend | Judging brand health and ad reliance |
| Related metric | The inverse of ROAS | The Amazon-level cousin of MER |
How to read your TACoS trend
With TACoS, the direction matters more than the number. The same 12% can be healthy or a warning depending on which way it’s heading, so read the trend across several months instead of a single snapshot.
A falling TACoS on flat or rising revenue is the case you want. Advertising is driving the velocity that lifts your organic rank, so each ad dollar pulls more free sales behind it and the business leans on paid a little less every month. That’s the flywheel working.
A rising TACoS is the early warning. Ad spend is outrunning revenue, which usually means organic sales are slipping, your cost per click is climbing, or you’re propping up the same sales with more budget. It tends to show up before a revenue dip does, which is what makes it worth watching.
A flat TACoS is steady state. Ads are holding position without compounding, which is fine on a mature product and worth a second look on one you’re trying to grow. The worked example below shows the healthy pattern: ACoS holds around 25% while TACoS falls as organic revenue climbs.
ACoS holds while TACoS falls: organic revenue doing more of the work each month
| Month | Ad spend | Ad sales | Total revenue | ACoS | TACoS |
| Month 1 | $2,000 | $8,000 | $16,000 | 25% | 12.5% |
| Month 2 | $2,100 | $8,400 | $19,000 | 25% | 11.1% |
| Month 3 | $2,200 | $8,800 | $22,500 | 25% | 9.8% |
| Month 4 | $2,300 | $9,200 | $26,000 | 25% | 8.8% |
What’s a good ACoS and a good TACoS?
There’s no single good number for either. A good ACoS is one comfortably below your break-even ACoS, and a good TACoS depends on your category and where the product sits in its life. Benchmarks give you context, not a target to copy.
Because break-even is set by your own margins, a good ACoS on a 60%-margin product would sink a 25%-margin one. Work from your contribution margin, set your target below the break-even line, and treat any blog average as a sense check. Commonly cited targets land between 15% and 30%, but yours is only right if it clears your own math.
TACoS benchmarks shift with category and product stage, so date them and expect ranges rather than a fixed figure. A very low TACoS can mean you’re under-investing in growth, while a higher launch TACoS is the price of buying rank, so read these against your own goals. As of mid-2026, a healthy TACoS looks roughly like this:
Healthy TACoS by product stage, as of mid-2026 (varies by category)
| Product stage | Healthy TACoS |
| Overall | 10-15% |
| Mature product | 5-10% |
| New launch | 15-25% |
Where ROAS and MER fit
Two related metrics round out the picture. ROAS (return on ad spend) is ACoS flipped: ad sales divided by ad spend, so ACoS = 1 ÷ ROAS. It’s the same campaign efficiency viewed from the revenue side, the line it needs to clear is your break-even ROAS, and it’s the number most platforms outside Amazon report.
MER (marketing efficiency ratio) is TACoS’s cross-channel cousin: total revenue against total ad spend across every channel you run, not Amazon alone. A brand selling on its own site and on Amazon watches MER at the top and TACoS within Amazon, so the two nest rather than compete.
Which should you optimize?
Optimize ACoS at the campaign level and judge success by TACoS at the business level. They work at different altitudes, so you run both rather than choosing between them.
ACoS is the dial you turn week to week: raise or cut bids, prune keywords, and trim wasted spend on the terms that don’t convert. TACoS is the gauge you read month to month, telling you whether all that tuning is compounding into organic strength or holding the line.
The trap is chasing the lowest possible ACoS until you starve the impressions that were feeding organic rank.
ACoS looks great, then total sales slide and TACoS drifts up, which is the signal that fewer ads meant fewer organic sales rather than more profit.
Both belong among the ecommerce KPIs you review every month, read together rather than alone. The rule of thumb: manage by ACoS, judge by TACoS.
See both numbers move over time
ACoS and TACoS only tell the story when you can watch them over time, and the Amazon console shows you one campaign at a time.
The ROAS & MER Tracker plots ad spend, ad sales, and total revenue side by side and calculates ACoS, TACoS, ROAS, and blended MER from your own numbers, so a falling TACoS on rising revenue reads as the flywheel it is, and a rising one flags the slip before it costs you a quarter.
Frequently asked questions
What is the difference between ACoS and TACoS?
ACoS is ad spend divided by the sales your ads directly generated, while TACoS is ad spend divided by all revenue, organic included, so ACoS measures campaign efficiency and TACoS measures advertising’s impact on the whole business. A rising TACoS with a flat ACoS usually means your organic sales are slipping.
What is a good TACoS on Amazon?
A good TACoS is roughly 10-15% for most brands as of mid-2026, dropping to 5-10% for mature products and running 15-25% during a launch, though it varies by category. The trend matters more than the number: a TACoS that falls as revenue grows is healthier than a low one that’s creeping up.
Is a lower TACoS always better?
A lower TACoS isn’t always better, because a very low number can mean you’re under-investing in ads and leaving growth on the table. A TACoS that’s falling because organic sales are compounding is healthy, while one that’s low only because you cut spend can cap your reach.
What's the difference between TACoS and ROAS?
TACoS is total ad spend divided by total revenue, a cost ratio for the whole business, while ROAS is ad revenue divided by ad spend, a return ratio for your campaigns. TACoS tells you how dependent the business is on ads; ROAS tells you how efficiently a specific campaign turns spend into sales.
Why is my TACoS higher than my ACoS?
Your TACoS shouldn’t come out higher than your ACoS, because TACoS divides by total revenue while ACoS divides by the smaller ad-sales figure, so TACoS normally sits below ACoS. If the two are equal or nearly so, your listing is making very few sales without ads, and organic is barely contributing.
How do you calculate inventory age?
Per SKU, subtract the received date (or last-sold date) from today’s date to get each item’s age in days. For a catalog-level figure, use average inventory age = (average inventory ÷ COGS) × 365, which is the same as your days inventory on hand and gives you one blended number to track over time.
