
Key takeaways
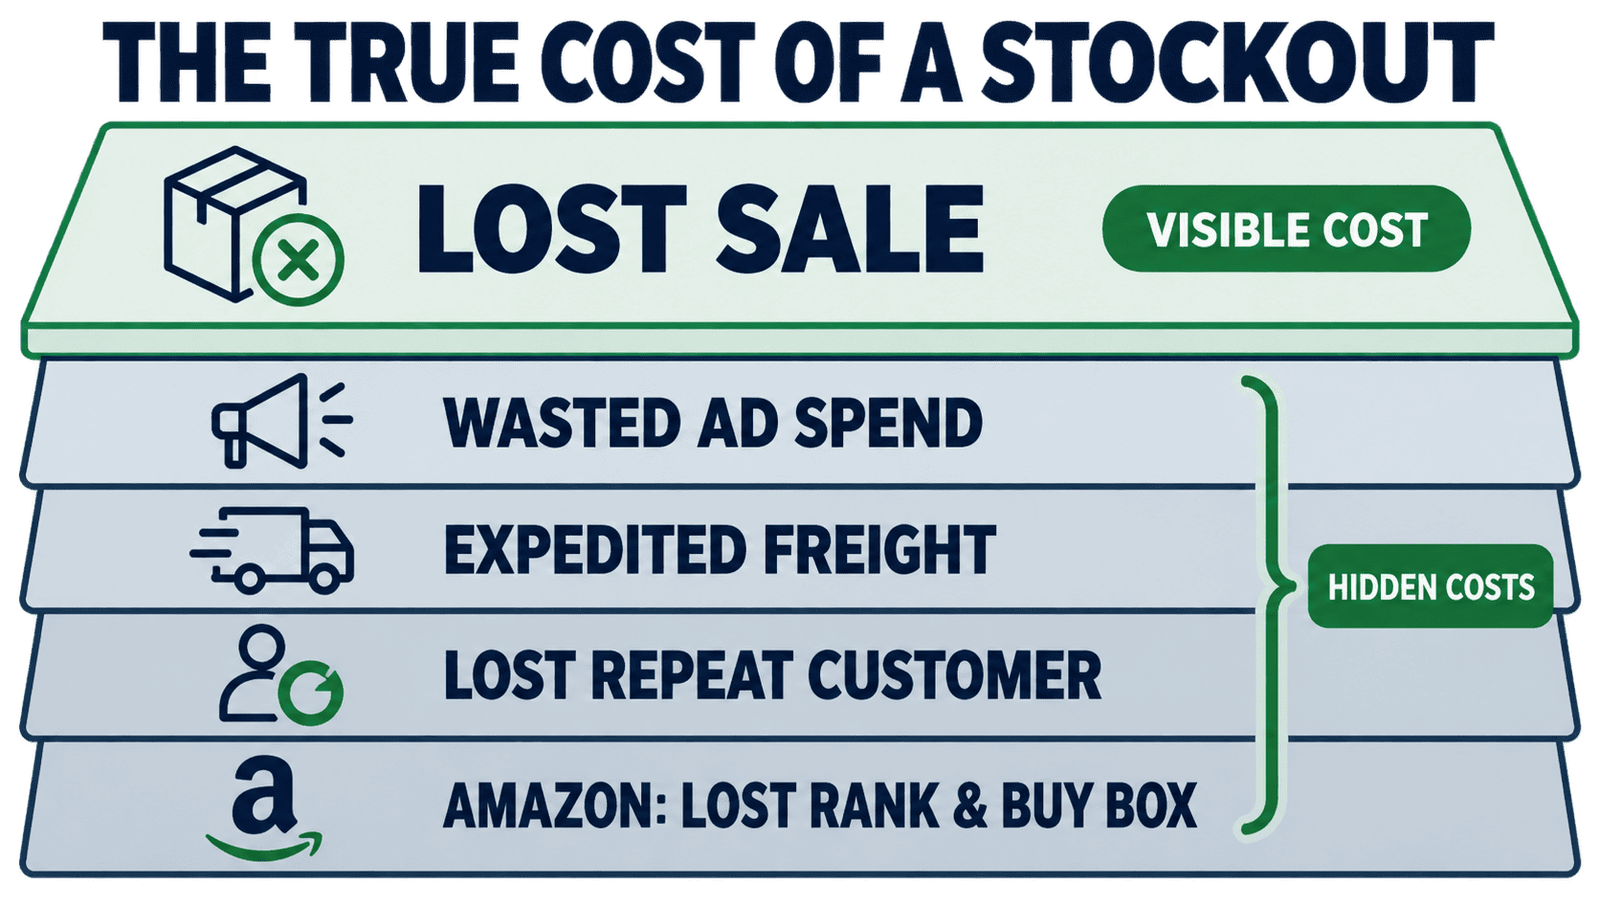
- A stockout is having zero sellable units of a product when a customer wants to buy it. The visible cost is the lost sale, and the real cost is bigger.
- Value a lost sale at contribution margin, not revenue: it’s the margin those units would have earned. Then add the ad spend that paid to send the shopper to a sold-out page and any expedited freight to recover.
- On Amazon a stockout costs more than the missed order. It drops your organic rank, hands the Buy Box to a competitor, and dents your IPI, and rank doesn’t come back the day the stock does.
- Track it with two numbers: a stockout rate, how often you’re out, and a fill rate, how much demand you served from stock. Most retailers run an out-of-stock rate somewhere around 2% to 10%.
- Stockouts are a planning gap more often than bad luck: no safety stock, a forecast that missed, or a supplier lead time longer than the reorder point assumed.
- You could end almost every stockout by holding a mountain of stock, but that just parks cash in dead inventory. The goal is a service level you choose on purpose, higher on your winners, lower on slow movers.
Your best seller is out of stock, the ads are still running, and the customer who just clicked through bought the same thing from someone else. The sale is gone, but so is the ad spend that chased it, and on Amazon, so is some of your ranking.
What is a stockout?
A stockout, or out-of-stock, is when you have no sellable units of a product available to meet demand, so an order can’t be filled. A SKU (the stock-keeping unit, your internal code for one product variant) hits zero on hand while customers are still trying to buy it.
Every stockout is a sale you were ready to make and couldn’t.
On your own site a stockout shows up as a sold-out button or a back-in-stock signup, and a checkout that never happens. On Amazon it’s worse than a missed order: the listing goes unavailable, you lose the Buy Box, and the listing’s search rank starts to slide while it sits at zero.
It’s worth separating two kinds. A true stockout means you have no units anywhere. A phantom stockout means you have units, but your system says zero, or it says you have stock you’ve already oversold, usually from a sync error across channels.
The customer experience is the same, but the fix is different: one is a buying problem, the other is a data problem.
What does a stockout cost you?
A stockout costs you the contribution margin on every sale you would have made while you were out, plus a set of second-order costs most sellers never add up. Contribution margin is what a sale leaves after the costs that rise with each order: the cost of goods, payment and platform fees, and shipping.
Start there, and the number is already bigger than it looks.
The direct cost is the margin you missed. Estimate the units you would have sold during the stockout from your recent run-rate or your forecast, then multiply by unit contribution margin, the margin each sale earns.
Use contribution margin, not revenue and not a vague “profit per unit,” so the figure reflects the money you truly lost.
Then come the costs the vendor guides skip. If your ads keep running while the product is out, you’re paying to send shoppers to a page they can’t buy from, so that ad spend is a straight loss.
Getting back in stock often means expedited or air freight and a rush purchase order, which cost more than planned replenishment. And a shopper who buys elsewhere may not come back, so you can lose their repeat value on top of the single sale.
Here’s the math on a typical stockout: a $45 product earning a $20 unit contribution margin, out of stock for 10 days while it was selling about 8 units a day.
Table 1. The real cost of a single 10-day stockout.
| Cost of one stockout | What it is | This example |
| Lost contribution margin | Margin on the sales you’d have made (80 units × $20) | $1,600 |
| Wasted ad spend | Ads kept sending clicks to a sold-out page | $300 |
| Expedited freight | Air freight and a rush PO to get back in stock | $450 |
| Measurable cost | What you can put a number on today | $2,350 |
| Harder to price | Lost repeat customers, and on Amazon, lost rank and Buy Box | Not in the total |
The hidden cost of a stockout on Amazon
On Amazon, a stockout does lasting damage well beyond the orders you miss, because the algorithm treats availability as a ranking signal. Run out of a ranked product and your organic position drops, and it recovers slowly after you restock rather than snapping back the day the units land.
Two more things happen while you’re out. You lose the Buy Box, the default add-to-cart on a listing, and if another seller offers the same product, they can take it and keep it. And your Inventory Performance Index (IPI), the score Amazon uses to rate how well you manage FBA stock, takes a hit.
Let IPI fall far enough, and Amazon can cap your storage or restock limits, which makes the next stockout more likely.
The practical takeaway: a stockout on a ranked FBA product is more expensive than the same stockout on your own site, because you pay for it twice, once in lost sales and again in lost rank you have to buy back.
That’s a reason to weight a bigger buffer toward the products that carry your Amazon rankings.
How do you measure stockouts?
You track stockouts with two numbers: a stockout rate, how often or how widely you’re out, and a fill rate, how much of demand you served from stock. Together they tell you whether running out is a rare exception or a standing tax on your sales.
Stockout rate is the share of the time you’re unavailable. A clean way to measure it is SKU-days: count the days each product spent at zero and divide by the total product-days in the period.
Fill rate, sometimes called the in-stock rate, is the demand you met from stock divided by total demand, so a 97% fill rate means you served 97% of what customers wanted without running out. Pull both from your sales and inventory history.
Table 2. The two numbers that measure stockouts.
| Metric | Formula | Worked example |
| Stockout rate | SKU-days out of stock ÷ total SKU-days | 12 of 600 = 2% |
| Fill rate (in-stock rate) | Demand met from stock ÷ total demand | 970 of 1,000 units = 97% |
What do stockouts cost you over a year?
The single-stockout math understates the problem, because a fill rate below 100% is a standing tax on every month, not a one-off. To size the annual cost, take the share of demand you’re missing and run it against a year of sales at your contribution margin.
Say you do $1M in annual revenue at a 40% contribution margin, and you hold a 97% fill rate. That 3-point gap is roughly $30,000 of sales you never made, or about $12,000 in lost contribution, before any wasted ad spend, expedited freight, or Amazon rank damage.
Closing the gap to 99% would recover most of that. Framing it this way turns “we run out sometimes” into a number you can weigh against the cost of holding more stock, which is the trade-off the last section comes back to.
Why do stockouts happen?
Stockouts are almost always a planning gap, not bad luck, and for an ecommerce brand they trace back to a short list of causes. Each one has a fix, and each fix lives in a specific part of your inventory planning. A demand spike from a promo or a viral moment empties the shelf faster than the plan expected.
A forecast that came in low leaves you short of what sold. With no safety-stock buffer, ordinary week-to-week variability is enough to run you out. When a supplier’s lead time is long or unpredictable, the reorder lands too late. And a reorder point set too low, or never updated, means you place the order after you’re already short.
Two more causes are worth naming because they hide. Cash and minimum order quantities can stop you from buying enough, so you knowingly run thin on some products.
And data errors cause oversells, where the system shows stock you don’t have, which is the phantom stockout from earlier. Here’s the short version and where each fix sits.
| Cause | What it looks like | The fix |
| Demand spike or promo | A sale or a viral moment cleans you out | Forecast for it and hold a buffer |
| Forecast miss | You planned low and sold through | A tighter demand forecast |
| No safety stock | Normal variability empties the shelf | A safety-stock buffer sized to your swings |
| Long or variable lead time | The reorder lands after you’re out | Reorder points set off real lead time |
| Reorder point too low | You reorder once you’re already short | Keep reorder points current per SKU |
| Cash or MOQ limit | You couldn’t afford the full reorder | Plan the buy against cash |
| Data error or oversell | The system says in stock, the shelf is empty | Reconcile inventory across channels |
How do you prevent stockouts?
You prevent stockouts with a connected planning system, not a single trick. Each piece below has a job, and each one is a link in the same chain, from knowing what’s coming to having it reorder itself on time.
Run them together and running out stops being a surprise.
- Forecast demand: Project what each product will sell so you’re buying to a number, not a hunch. A workable demand forecast is the input everything else depends on.
- Hold safety stock: Carry a buffer sized to how much your demand and lead times swing, so normal variability doesn’t empty the shelf. It’s the shock absorber between a good forecast and a late delivery.
- Set a reorder point per SKU: Reorder when on-hand hits the demand you expect over the supplier’s lead time plus that buffer. Getting the reorder point and the lead time right is what makes the order land before you hit zero.
- Run a replenishment cadence: Review and reorder on a routine, weekly for fast movers, so restocking is a habit instead of a scramble after something sells out.
- Watch days of cover: Track how long your stock will last at the current sales rate, so a product heading for a stockout flags itself while you still have time to act.
- Weight buffers toward winners: Put the biggest buffers on your best sellers and your ranked products, where a stockout costs the most, and run slow movers leaner.
The trade-off: service level vs cash
You could end almost every stockout tomorrow by holding a mountain of stock. That’s the catch: safety stock is cash you’re choosing to tie up, and inventory is usually the biggest cash drain in an ecommerce business.
Push service levels toward perfect and you pay more buffer for less and less protection, and you risk turning a stockout problem into an overstock one, the aged and dead stock you later have to discount or write off.
So the goal isn’t zero stockouts. It’s a service level you set on purpose: higher for your winners and the products carrying your Amazon rank, lower for slow movers where a brief gap costs little.
Choose the number against your cash, then let the forecast, the buffers, and the reorder points hold it, instead of panic-buying after every product that runs out.
| Zero stockouts isn’t the goal, and chasing it buries cash in inventory you can’t sell. Pick a service level instead: big buffers on the products you can’t afford to lose, lean stock on the ones you can, sized to the cash you have. |
Frequently asked questions
What is a stockout?
A stockout, or out-of-stock, is when you have no sellable units of a product to meet customer demand, so the order can’t be filled and the sale is lost or delayed. It can be a true stockout, no units anywhere, or a phantom one, where a data error shows zero in stock you have.
What does a stockout cost?
A stockout costs the contribution margin on every sale you would have made while out, plus second-order costs: ad spend that paid to send shoppers to a sold-out page, expedited freight to restock, lost repeat customers, and on Amazon, lost organic rank and the Buy Box.
How do you calculate the cost of a stockout?
Estimate the units you would have sold during the stockout from your recent run-rate or forecast, multiply by unit contribution margin, then add any wasted ad spend and expedited freight or rush-order costs. That gives you the measurable loss before the harder-to-price damage.
What is a good stockout rate or fill rate?
Most retailers run an out-of-stock rate somewhere around 2% to 10%, so a fill rate in the mid-to-high 90s is a common target, and the classic worldwide study put the average out-of-stock rate near 8%. The right level depends on the product: higher for best sellers, lower for slow movers.
What causes stockouts?
Demand spikes and promos, forecast error, no safety stock, supplier lead times that are longer or more variable than planned, a reorder point set too low or left unmaintained, cash and minimum-order-quantity limits, and data errors that cause oversells. Most trace back to planning rather than luck.
How much safety stock do I need to prevent stockouts?
Enough to cover the demand and lead-time variability you see, not a flat number of weeks. Safety stock is sized from how much demand swings and how unpredictable your supplier is, and you set a higher buffer on best sellers and ranked products than on slow movers. The buffer plus the reorder point is what keeps the order landing before you hit zero.
How do you prevent stockouts?
Forecast demand, hold safety stock sized to your variability, set a reorder point per SKU, keep a routine replenishment cadence, and weight the biggest buffers toward your best sellers, so you reorder in time instead of reacting after you’ve run out.
What’s the difference between a stockout and dead stock?
A stockout is having too little of what sells; dead stock is having too much of what doesn’t. They’re two ends of the same planning problem, so over-buying to avoid stockouts can create dead stock, which is why the goal is a planned service level that balances both.
