
Key takeaways
- Blended ecommerce CAC commonly runs $45–$90, but per-channel CAC ranges from near-zero on email to $120–$230 on fully-loaded paid social (as of mid-2026).
- CAC is acquisition spend divided by new customers, and it only means something next to what a customer is worth.
- The same channel has three CACs: platform-reported CPA, fully-loaded channel CAC, and blended CAC, and most benchmarks quote one without saying which.
- Google search is the cheapest paid channel for high-intent buyers, while email, SMS, and referral carry near-zero marginal cost and stay under-funded.
- Privacy changes broke clean last-click tracking, so blended CAC and MER are the most reliable scoreboard for channel efficiency.
Customer acquisition cost swings more by channel than by almost anything else you do. Email can cost close to nothing, paid social can run past $200, and the same channel shows three different CAC numbers depending on what you count.
Here’s the honest 2026 benchmark by channel, and which number to trust.
What’s the average CAC by marketing channel?
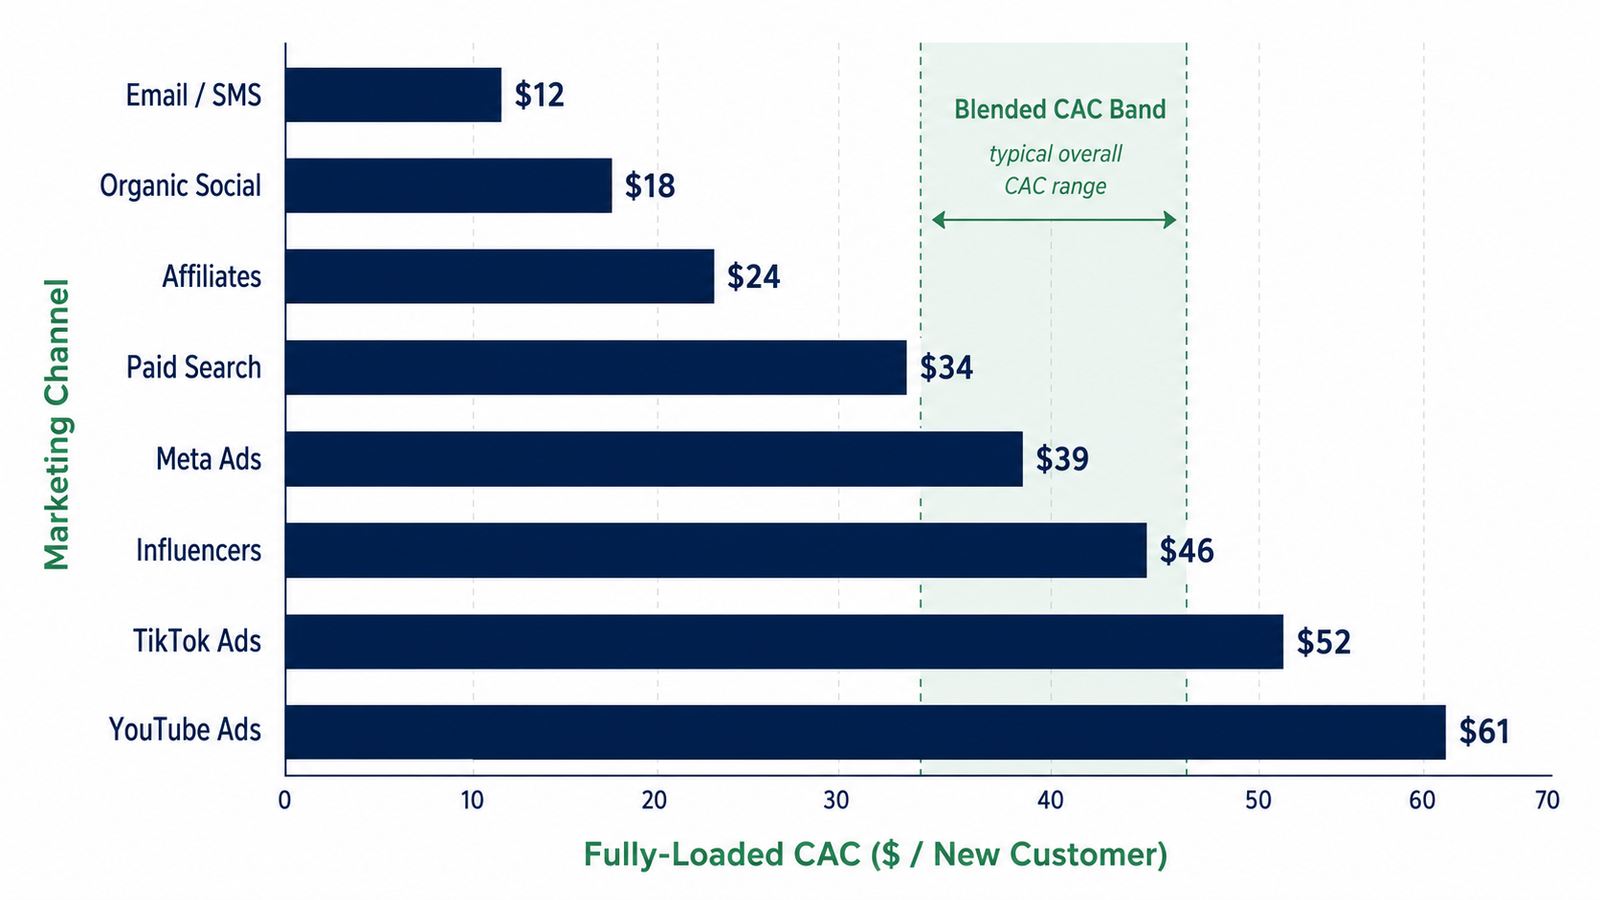
Blended ecommerce customer acquisition cost commonly runs $45–$90, but the per-channel spread is what matters. Email and SMS cost close to zero on an owned list, paid Google search runs $50–$130 for high-intent buyers, and fully-loaded paid social sits around $120–$230.
These ranges are current as of mid-2026.
CAC is what you spend to win one new customer: acquisition spend divided by new customers over the same period. That single formula hides most of the story, because the cost depends almost entirely on the channel and how much of its overhead you fold in.
If you want to run your own number and see the ratio it feeds, start with the LTV:CAC ratio. This guide is about the benchmark: what’s normal per channel once you have your figure.
CAC has climbed hard in recent years, up roughly 40% since 2023 as ad auctions got more crowded and privacy changes made targeting less efficient. A channel CAC that looked steep two years ago can be normal today, which is why the date on any benchmark matters as much as the number.
CAC benchmarks by channel
There’s no single CAC, because the cost is set by the channel far more than by how well you run the account. Owned channels like email and SMS carry almost no marginal cost once the list exists.
High-intent search sits in the middle, since you’re paying for demand that’s already there. Paid social carries the full cost of creative, testing, and the team behind it.
Table 1. Typical fully-loaded CAC by marketing channel, as of mid-2026. Ranges vary widely by vertical, average order value, and how each brand counts acquisition cost.
| Marketing channel | Typical CAC (fully-loaded) | Note |
| Email / SMS | $0–$15 | Near-zero marginal cost on an owned list; most under-invested |
| Referral / word-of-mouth | $20–$50 | Cheap but hard to scale on demand |
| Organic / SEO | $10–$40 (amortized) | Content and time cost up front; compounds over time |
| Affiliate | $30–$80 | Pay-per-result, so margin-friendly and predictable |
| Google Search (paid) | $50–$130 | High-intent buyers; the cheapest paid channel for ready demand |
| TikTok | $90–$130 | Cheaper CPMs than Meta, lower direct conversion; trend-led |
| Meta (Facebook / Instagram) | $120–$230 fully-loaded ($40–$60 platform CPA) | The scale workhorse; two valid numbers |
| Influencer / creator | $40–$300+ | Swings by creator tier; the all-in cost is easy to underestimate |
Read your number against the same channel and your own trend, not the blended average. A $120 CAC is strong on Meta and steep on email. What matters as much as the level is the direction: a channel whose CAC climbs month over month is usually saturating, and the next dollar is buying less.
Why channel CAC numbers disagree: platform, channel, and blended
Look up Meta CAC and you’ll find $50 in one source and $220 in the next. Both are right, because they’re counting different things. The same channel carries three separate numbers, and a benchmark is close to useless unless you know which one it’s quoting.
Platform CPA is what Meta or Google reports in its own dashboard, and it’s the flattering number, roughly $40–$60 on Meta, because the platform takes credit for conversions it may only have touched.
Fully-loaded channel CAC adds the creative, tools, and team cost behind that spend, which pushes Meta closer to $210. Blended CAC is total acquisition spend divided by all new customers, and it’s the number your bank balance agrees with.
Table 2. Three CACs for the same Meta spend (illustrative).
| Which CAC | What it counts | Typical figure |
| Platform CPA | Conversions Meta’s dashboard claims, per ad spend | ~$50 |
| Fully-loaded channel CAC | Ad spend plus creative, tools, and team | ~$210 |
| Blended CAC | All acquisition spend ÷ all new customers | ~$95 |
Privacy changes made this worse. Since last-click tracking broke, platform-reported numbers over-credit themselves, and two channels will each claim the same sale.
That’s why operators lean on blended CAC and MER as the scoreboard, measured against the break-even ROAS each channel has to clear, and reach for marketing mix modeling when they need to split credit fairly.
What makes a channel CAC “good”
A CAC is never good or bad on its own; it’s only good relative to what the customer is worth. A $130 cost to acquire a buyer is healthy when the average order is $400 and they come back, and it’s painful when the order is $40 and they never return.
So the honest test isn’t whether your CAC beats a benchmark. It’s whether it clears your net profit margin and leaves the customer worth more than they cost.
Read CAC next to margin and lifetime value, the way you’d read any of the ecommerce KPIs that decide whether growth is profitable, rather than chasing the lowest number on the chart.
Here’s the quick math. If a product costs you $30, sells for $80, and takes $12 to ship and handle, you clear about $38 of contribution before marketing. That $38 is your CAC ceiling on a single order: acquire for less and the first purchase profits, acquire for more and you’re betting on the second order to bail you out.
A high repeat rate lifts that ceiling; a one-time product leaves you no room.
The channels operators under-invest in
Because email, SMS, referral, and organic carry near-zero marginal cost, every customer they bring in pulls your blended CAC down. Yet brands under $10M routinely under-fund them and pour the budget into paid social. A few levers move the blended number more than a better ad account will:
- Owned channels first: An engaged email and SMS list re-sells to customers you already paid to acquire, so the second purchase costs almost nothing.
- Referral and loyalty: A referral program turns happy customers into a near-free acquisition channel, especially in high-repeat categories.
- Retention over acquisition: Lifting your repeat purchase rate raises what each customer is worth, which lets you afford a higher CAC where it scales.
- Channel mix discipline: Shifting spend toward high-intent search and away from a saturating channel lowers blended CAC without cutting growth.
- Creative and offer testing: On paid social, better creative is the biggest lever on CAC, since it lifts conversion before you touch the bid.
See which channel is actually paying off
A channel benchmark only helps if you can see your own spend beside it.
The ROAS / MER Tracker pulls your spend and revenue by channel into one view, tracks blended CAC and MER against the target you set, and flags which channels are carrying their weight, in Excel or Google Sheets.
Watch the blended number instead of the one the ad platform hands you.
Frequently asked questions
What is a good CAC for ecommerce?
A good ecommerce CAC is one your margins and lifetime value can support, not a fixed dollar figure. As a rule of thumb, aim for a lifetime value at least three times your CAC. Blended CAC commonly runs $45–$90, but a high-AOV, high-repeat brand can profit at a much higher number than a low-price, one-time-purchase store.
Which marketing channel has the lowest CAC?
Email and SMS have the lowest CAC by far, often near-zero, because they market to an audience you already own. Referral and organic search follow. Among paid channels, Google search usually has the lowest CAC, since you’re paying for buyers who are already looking for what you sell.
Why is my Meta CAC so high?
A rising Meta CAC usually means creative fatigue, a saturating audience, or the fully-loaded cost of agency and tools that platform numbers leave out. The dashboard CPA can look fine while your blended CAC climbs. Refreshing creative and widening the offer move Meta CAC more than bid changes do.
What’s the difference between CPA and CAC?
CPA (cost per acquisition) is usually the platform’s cost for a tracked conversion on one channel, while CAC (customer acquisition cost) is the fully-loaded cost to win a customer across everything you spend. CPA is almost always the lower, more flattering number. Blended CAC counts every dollar and every new customer.
How do I lower my customer acquisition cost?
Lower CAC by leaning on near-zero channels like email, SMS, and referral, improving paid-social creative before bids, and shifting spend away from saturating channels toward high-intent search. Raising retention also helps, because a higher repeat rate lets each customer absorb more acquisition cost.
